Open Access
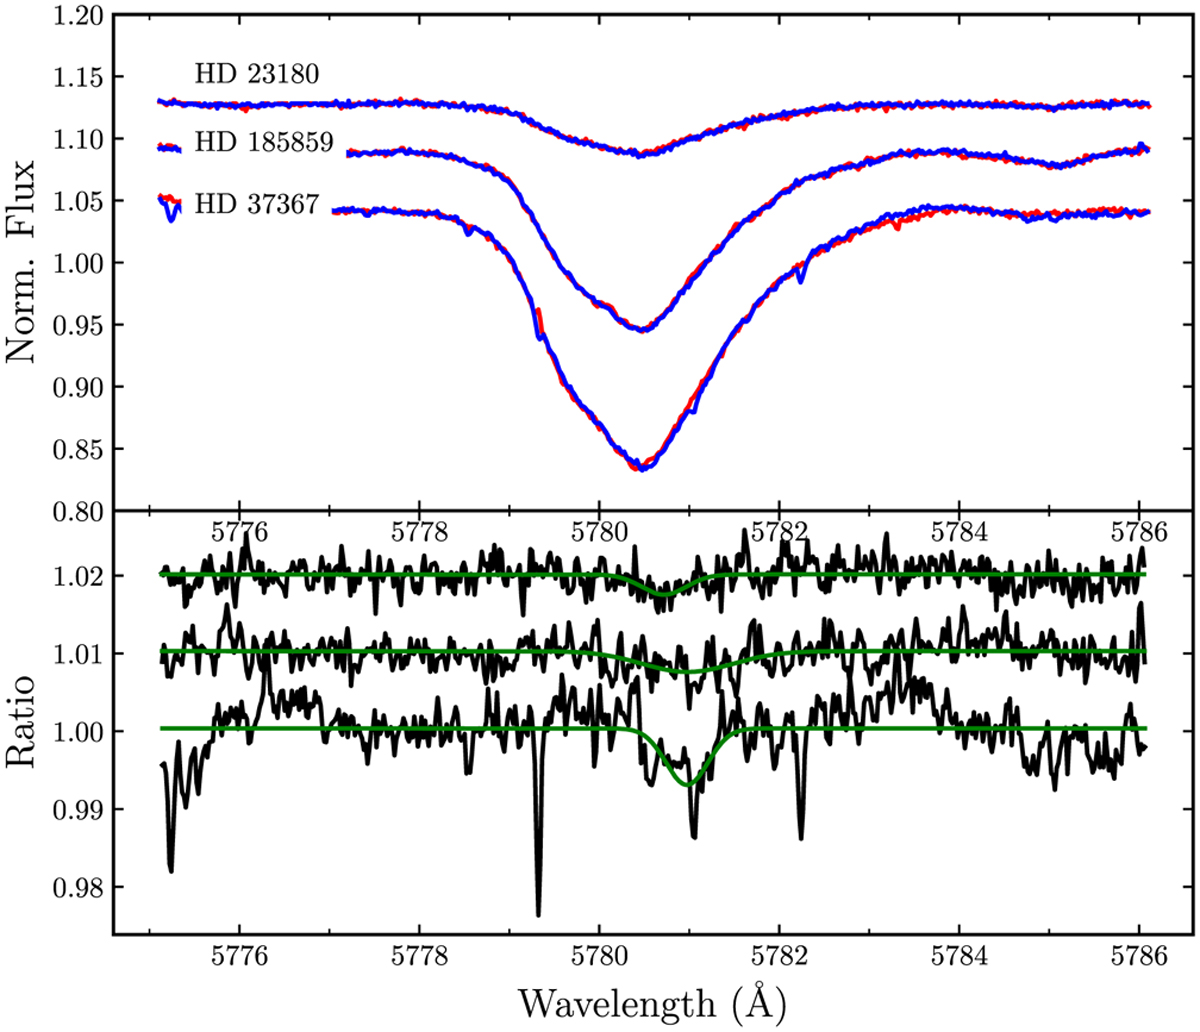
Fig. 3
Download original image
λ5780 profile toward HD 23180, HD 185859, and HD 37367 sightlines. The upper panel compares two epochs with red for the first observation and blue for the latest one. The lower panel shows the ratio spectra in the same order as the upper panel is sorting. The green line determines the Gaussian model to the ratio.
Current usage metrics show cumulative count of Article Views (full-text article views including HTML views, PDF and ePub downloads, according to the available data) and Abstracts Views on Vision4Press platform.
Data correspond to usage on the plateform after 2015. The current usage metrics is available 48-96 hours after online publication and is updated daily on week days.
Initial download of the metrics may take a while.