Fig. 2
Download original image
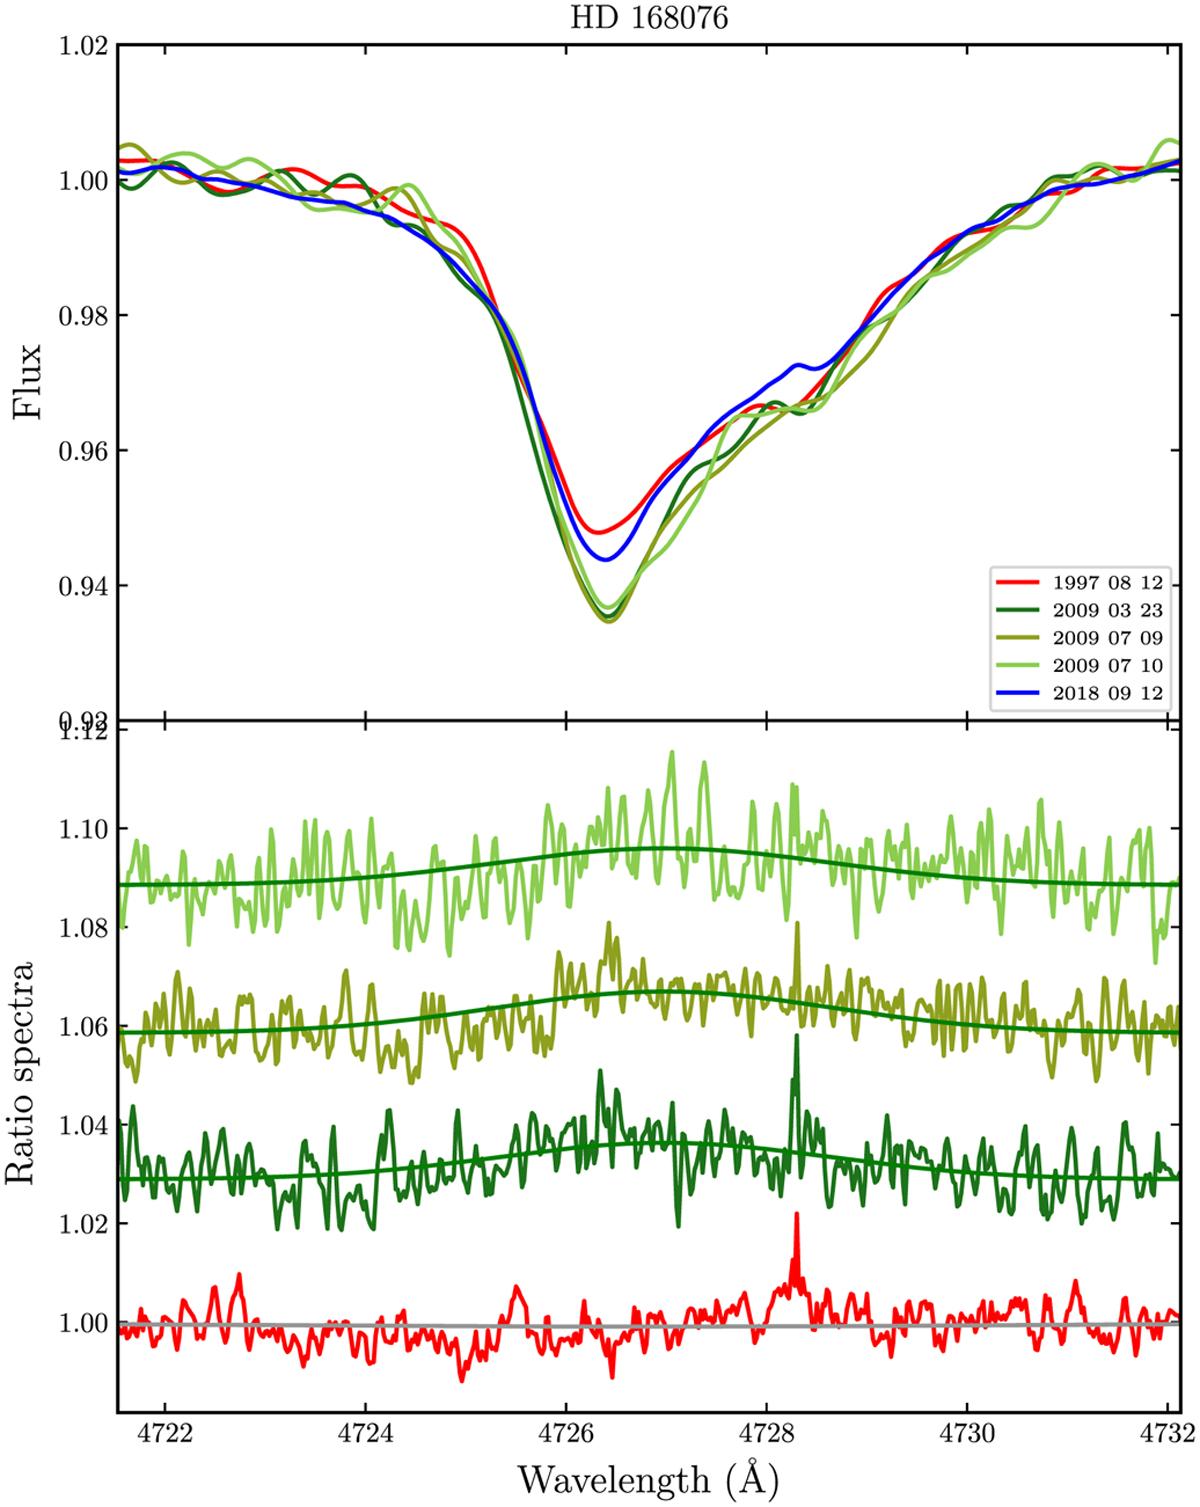
Variation in λ4727 DIB spectra towards HD 168076 used in this study. The EDIBLES spectrum is plotted in blue, and the earliest archival spectrum is in red; the intermediate observations are in green. The spectra are smoothed using a Gaussian convolution to minimize noise and better bring out the variations. The lower panel shows the ratio spectra and the fitted Gaussian model in each case. The top three ratio spectra (dividing the intermediate spectra by the EDIBLES spectrum) indicate significant variation, while the bottom ratio spectrum shows insignificant change when comparing the oldest archival to the EDIBLES observations.
Current usage metrics show cumulative count of Article Views (full-text article views including HTML views, PDF and ePub downloads, according to the available data) and Abstracts Views on Vision4Press platform.
Data correspond to usage on the plateform after 2015. The current usage metrics is available 48-96 hours after online publication and is updated daily on week days.
Initial download of the metrics may take a while.