Fig. 1
Download original image
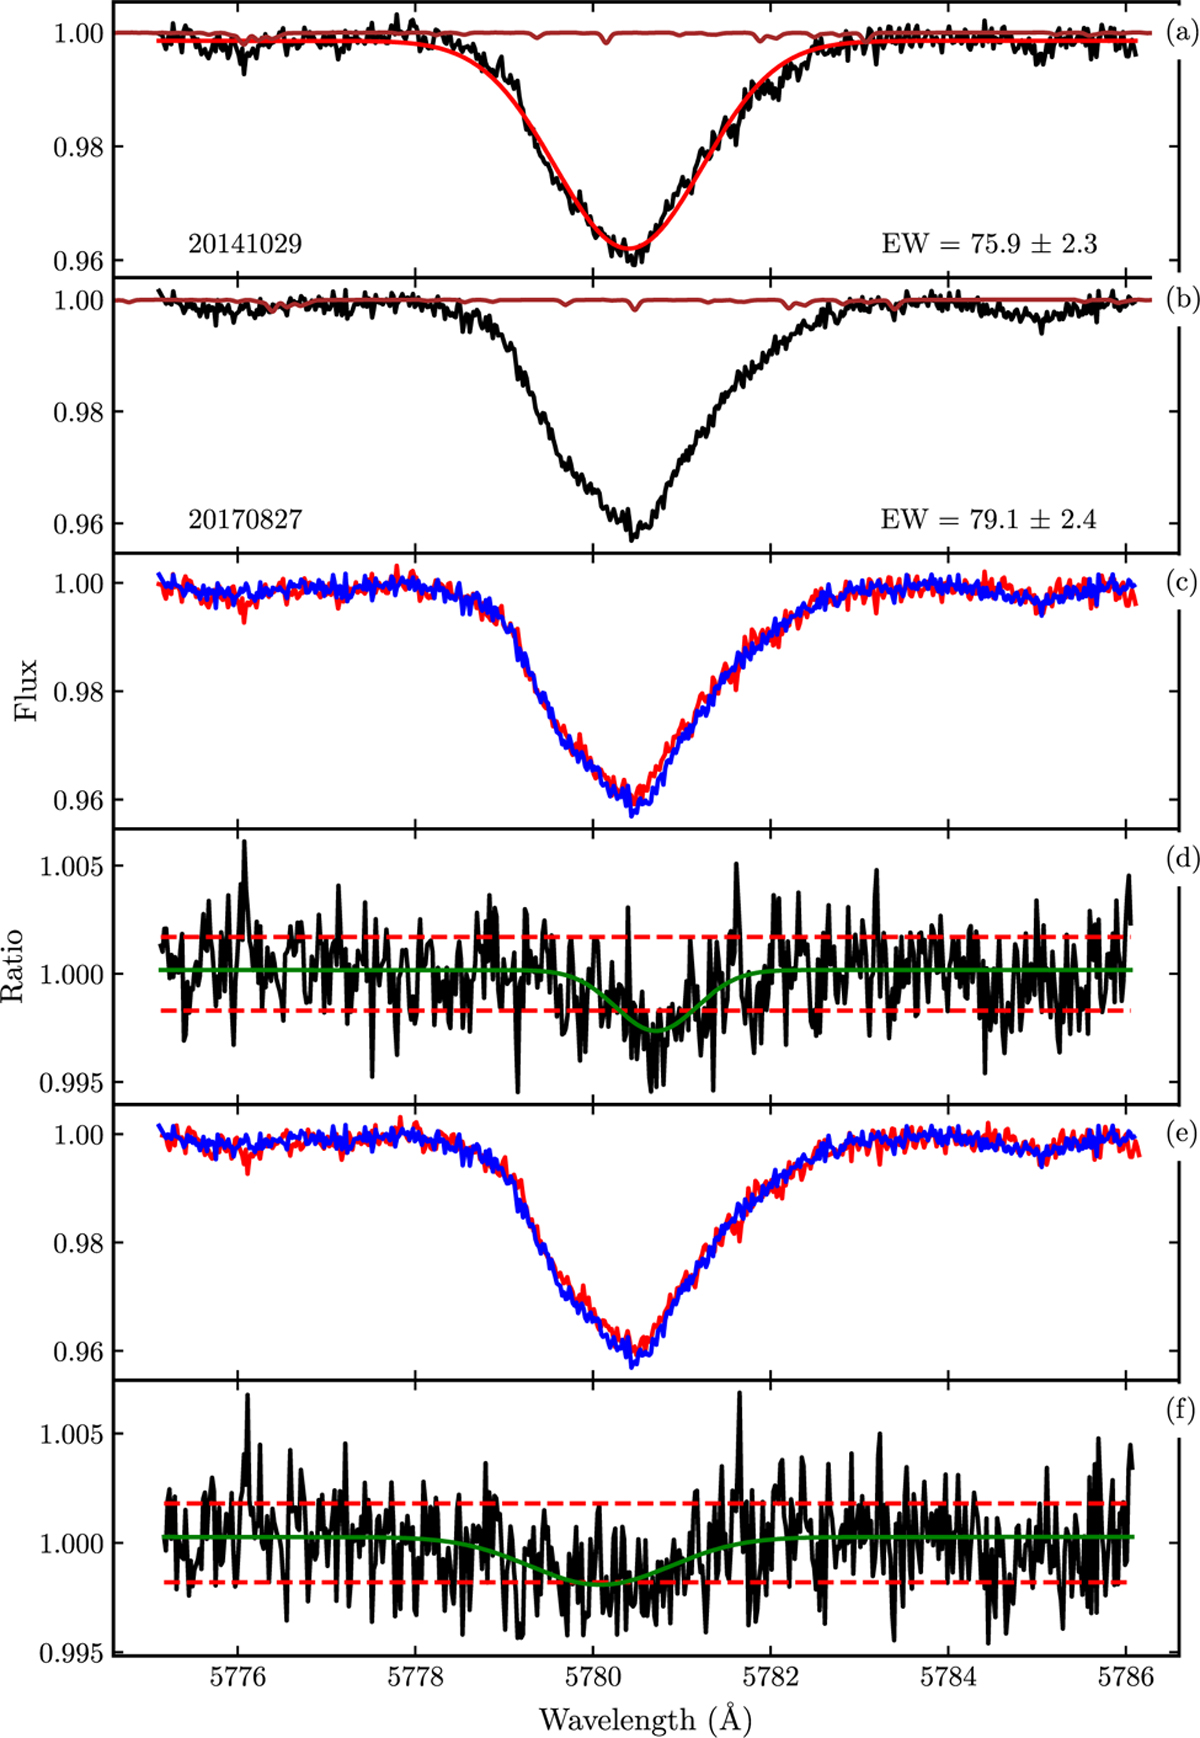
Variation in λ5780 DIB toward HD 23180. (a): EDIBLES “archival” observations on 2014-10-29 (black) and the best-fit Gaussian model (solid red line) and the atmospheric transmission spectrum (brown) showing weak telluric lines. (b) Same as panel (a) but for the second epoch on 2017-08-27. (c) Comparison of the first (solid red line) and second (solid blue line) epochs. We note that the profiles are very similar but not 100% identical. (d) The ratio spectrum. The dashed red lines show the 1-σ band around unity. The green solid line shows the best-fit Gaussian to the ratio spectrum. (e) same as (c), but now the 2014 archival spectrum has been shifted by 0.04 Å. (f) The ratio spectrum of the two spectra in (e). We note that the apparent Gaussian feature from (d) has become much broader and is shifted to the blue, but has not disappeared.
Current usage metrics show cumulative count of Article Views (full-text article views including HTML views, PDF and ePub downloads, according to the available data) and Abstracts Views on Vision4Press platform.
Data correspond to usage on the plateform after 2015. The current usage metrics is available 48-96 hours after online publication and is updated daily on week days.
Initial download of the metrics may take a while.