Fig. 4.
Download original image
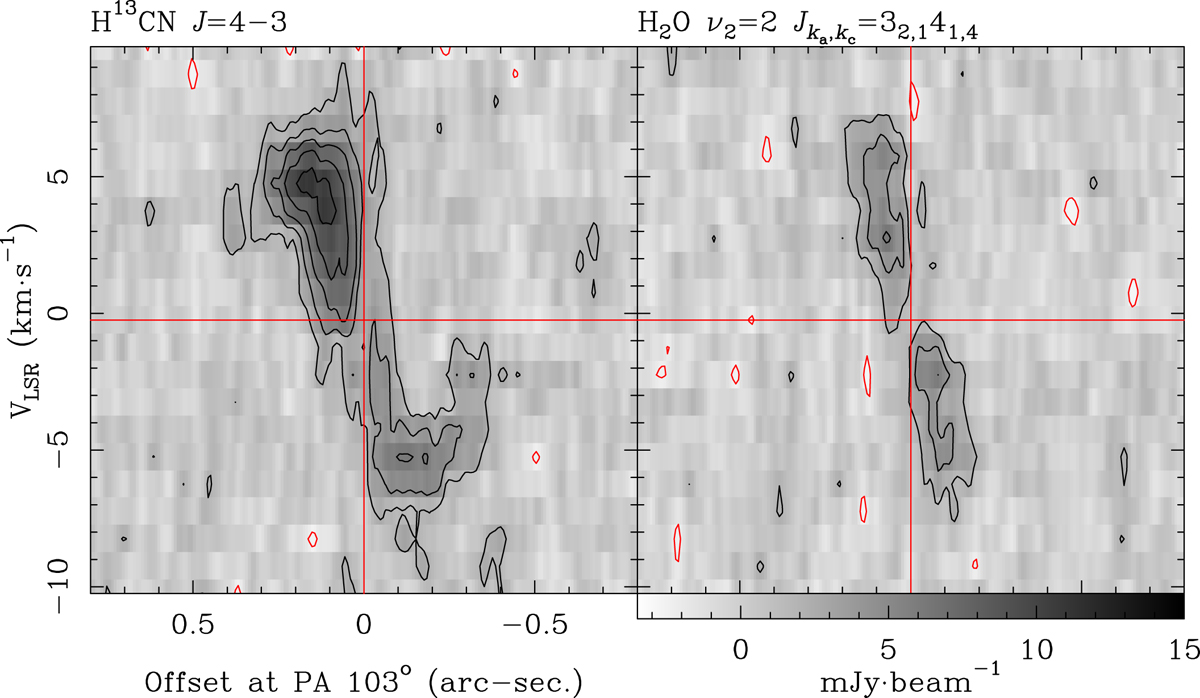
Velocity vs. position plot along the equatorial direction (PA 103°) of the Red Rectangle nebula for H13CN J = 4−3 (left panel) and H2O ν2 = 2 JKa, Kc = 32, 1–41, 4 (right panel). The velocity resolution is 1 km s−1 and the mean spatial resolution is 53 mas (see Sect. 2.1). Contours are −2 (red) and +2 to +10 by +2 (black) mJy beam−1; 1 mJy beam−1 is equivalent to 3.6 K. The adopted LSR systemic velocity (−0.25 km s−1) and center of the nebula (continuum peak) are indicated by the red lines.
Current usage metrics show cumulative count of Article Views (full-text article views including HTML views, PDF and ePub downloads, according to the available data) and Abstracts Views on Vision4Press platform.
Data correspond to usage on the plateform after 2015. The current usage metrics is available 48-96 hours after online publication and is updated daily on week days.
Initial download of the metrics may take a while.