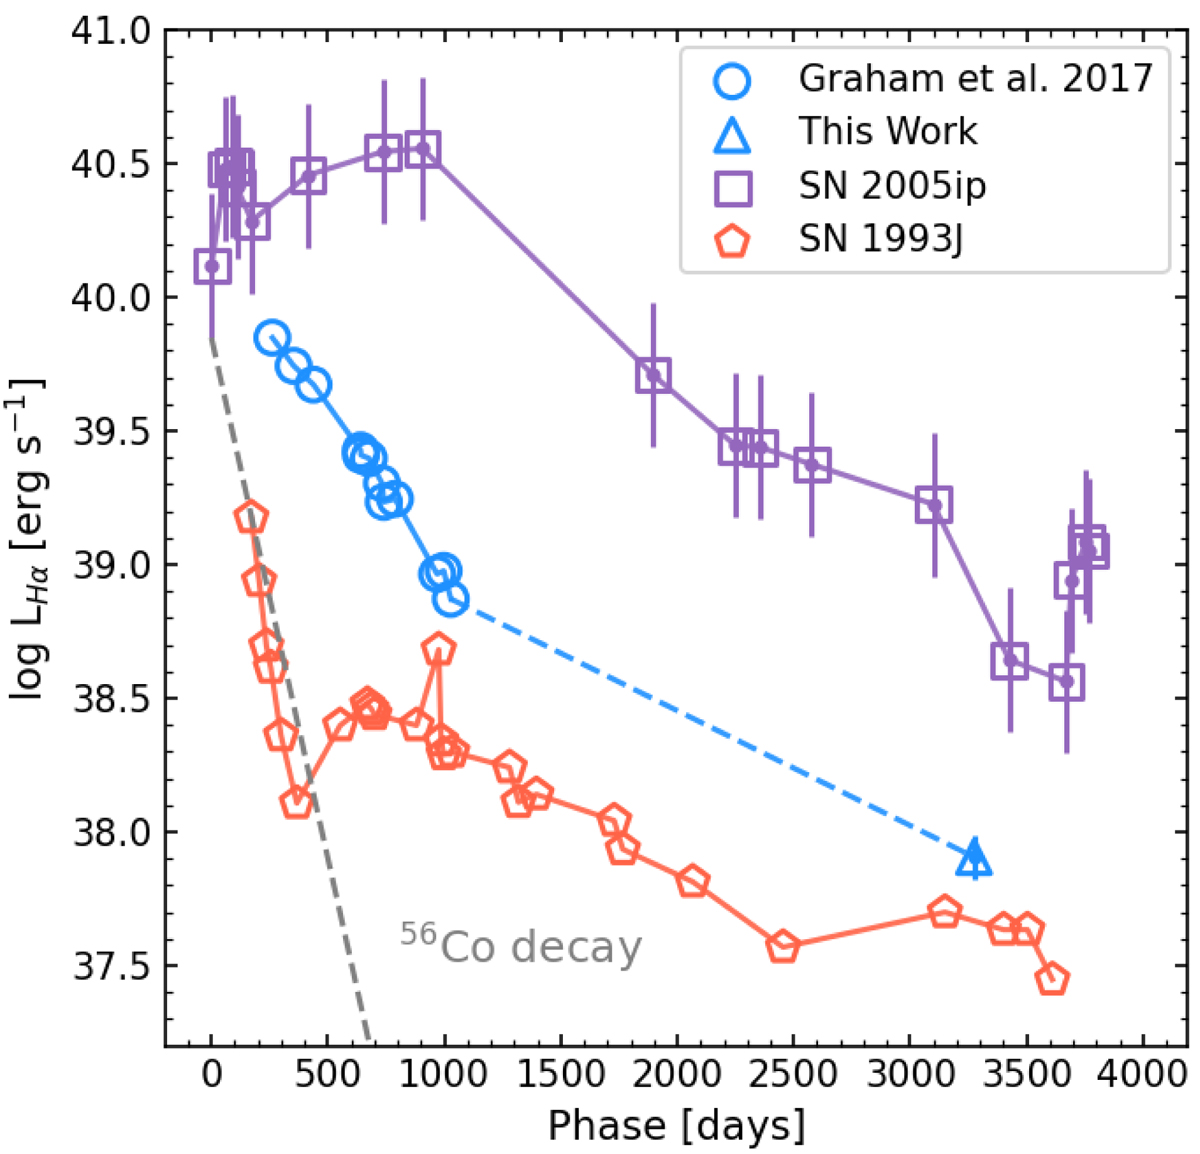
Fig. 3.
Download original image
Luminosity evolution of the Hα line in SN 2009ip between 251 and 3274 days after the peak of Event B (in blue). The triangle shows the value presented in this work, while the circles represent the values from Graham et al. (2017). We also show the evolution of the Hα luminosity for the long-lived SN 2005ip (purple squares, Smith et al. 2009, 2017), between 1893 and 3768 days after peak brightness, and SN 1993J (orange pentagons, Chandra et al. 2009), between 170 and 3608 days after peak. The gray dashed line highlights the expected decline rate of the luminosity if the Hα emission was driven by 56Co decay, following L ∝ 2−t/77.3.
Current usage metrics show cumulative count of Article Views (full-text article views including HTML views, PDF and ePub downloads, according to the available data) and Abstracts Views on Vision4Press platform.
Data correspond to usage on the plateform after 2015. The current usage metrics is available 48-96 hours after online publication and is updated daily on week days.
Initial download of the metrics may take a while.