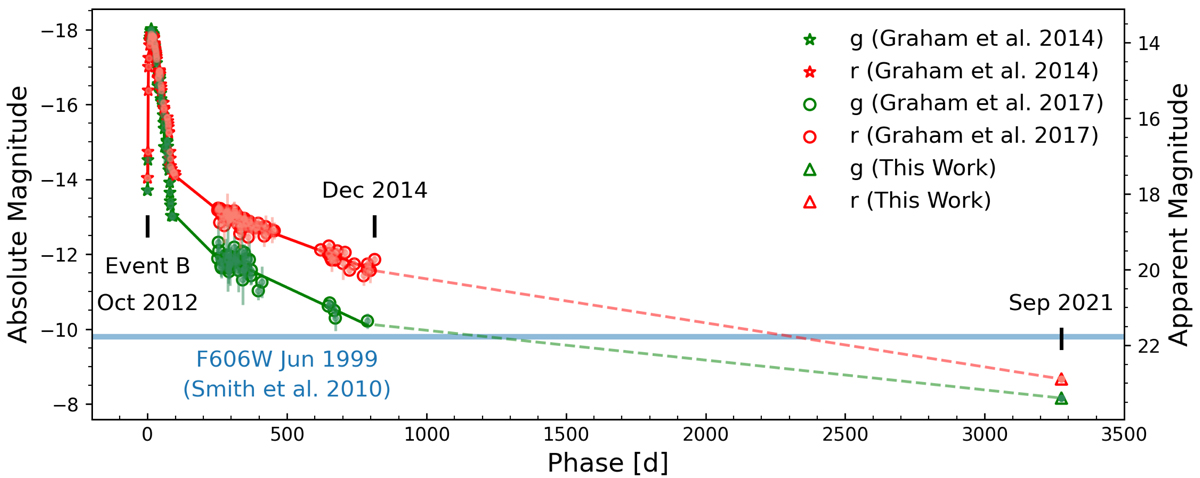
Fig. 1.
Download original image
Late-time photometric evolution of SN 2009ip, with the photometry presented in this work in r (red triangle) and g (green triangle) bands, obtained on 2021 August 10. The figure also shows the photometry in r and g bands around the event 2012B, presented in Graham et al. (2014), and the late-time photometric evolution in these bands, between 251 and 813 days after Event B, presented in Graham et al. (2017). the dashed lines show the inferred slope of the source between the last reported observation and our photometry. Phase is given in relation to the begging of Event B.
Current usage metrics show cumulative count of Article Views (full-text article views including HTML views, PDF and ePub downloads, according to the available data) and Abstracts Views on Vision4Press platform.
Data correspond to usage on the plateform after 2015. The current usage metrics is available 48-96 hours after online publication and is updated daily on week days.
Initial download of the metrics may take a while.