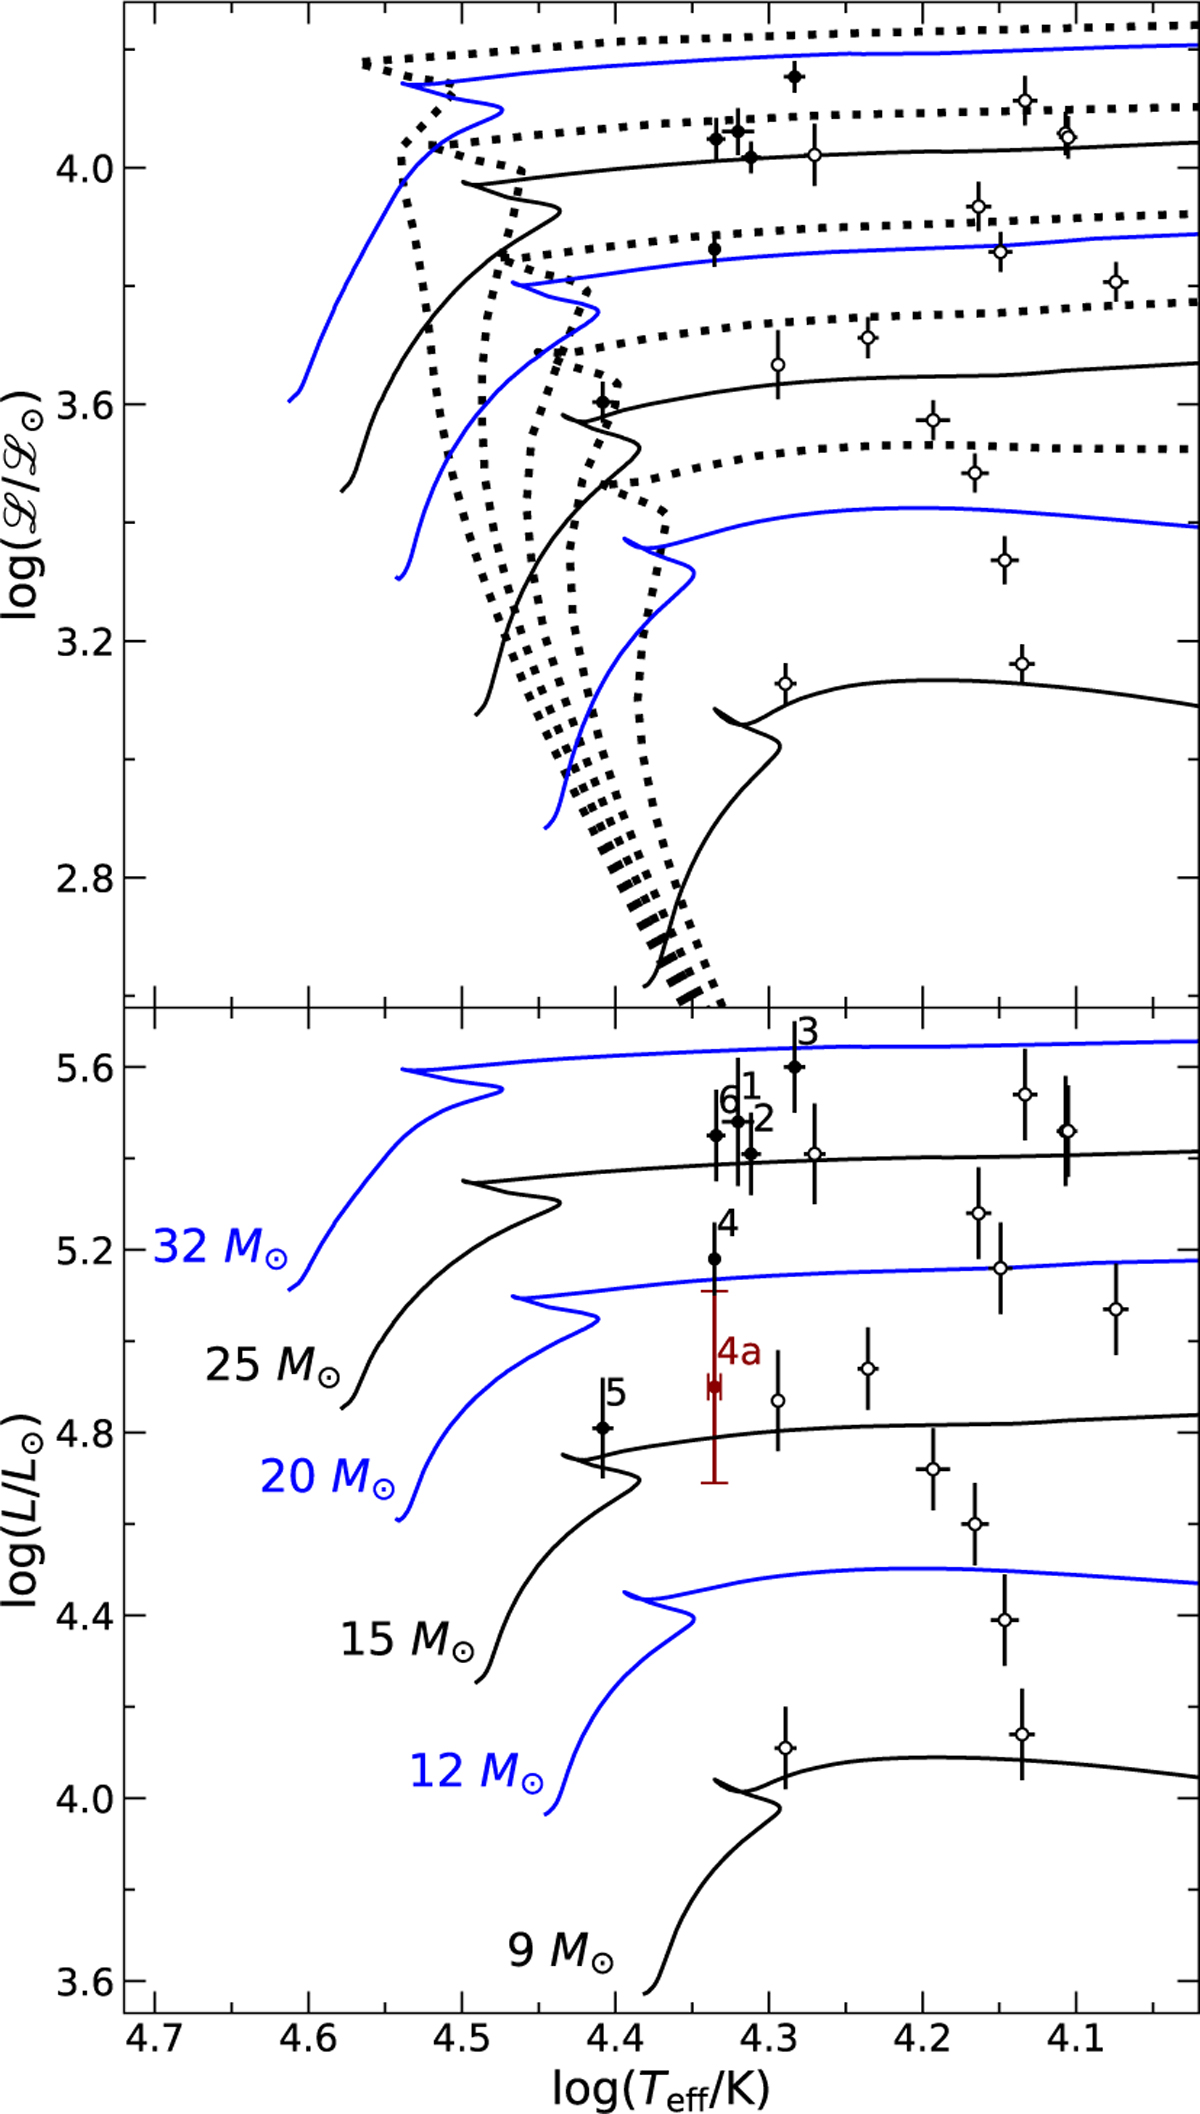
Fig. 8
Download original image
Location of the sample objects (black dots with error bars) and B-type supergiants analysed in Paper I (open symbols) in two diagnostic diagrams, the sHRD (upper panel) and the HRD (lower panel). For comparison, loci of evolution tracks for stars rotating at Ωrot = 0.568 Ωcrit (Ekström et al. 2012) are indicated for various ZAMS-masses. Isochrones for the model grid, corresponding to ages of log τevol ∈ {6.75, 6.85, 6.95, 7.05, 7.20} are depicted as dotted lines in the upper panel (increasing in age from top to bottom). For HD 91316 the luminosity as derived from the parallactic distance (ID#4a in Table 3) is depicted with a red symbol and marked accordingly. Error bars indicate 1σ uncertainty ranges.
Current usage metrics show cumulative count of Article Views (full-text article views including HTML views, PDF and ePub downloads, according to the available data) and Abstracts Views on Vision4Press platform.
Data correspond to usage on the plateform after 2015. The current usage metrics is available 48-96 hours after online publication and is updated daily on week days.
Initial download of the metrics may take a while.