Fig. 6
Download original image
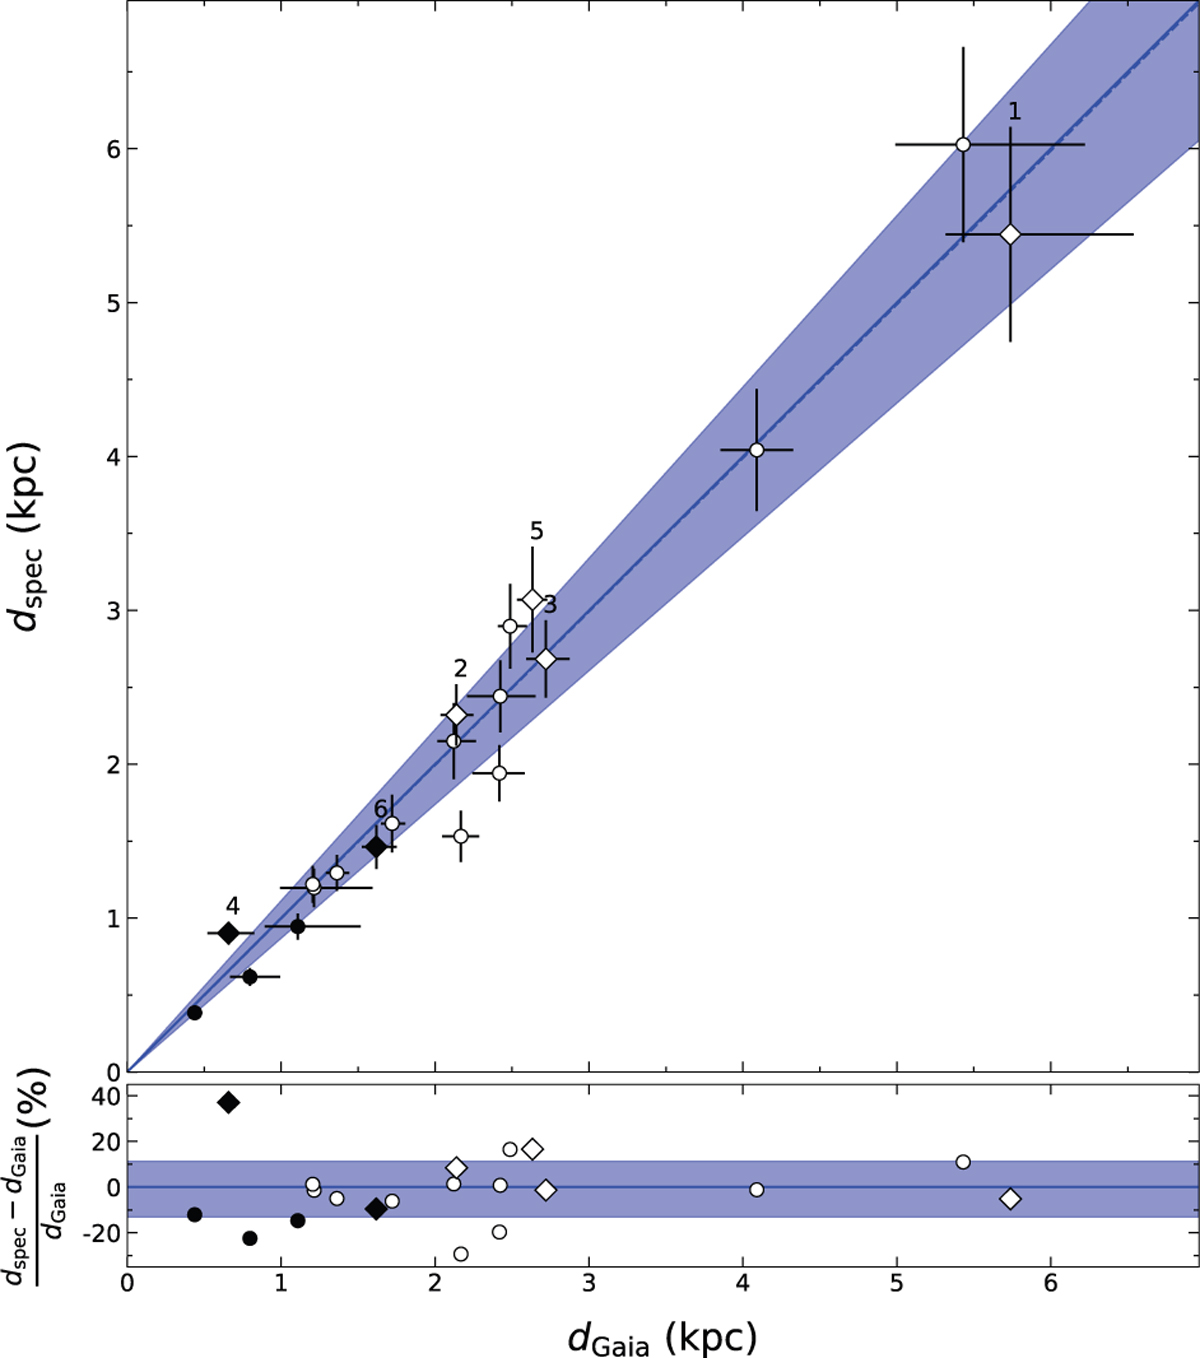
Comparison of derived spectroscopic distances and distances based on Gaia EDR3 parallaxes (upper panel), and their relative differences (lower panel). Diamonds represent the objects analysed in this work, while dots correspond to those of Paper I – filled symbols are used to depict objects with RUWE values >1.3. The solid blue lines depict equivalence, while the dashed line shows the best linear fit to the data. The shaded area marks the region of 1σ standard deviation from the mean. In the fit, only data with good RUWE values were employed, that is the open symbols.
Current usage metrics show cumulative count of Article Views (full-text article views including HTML views, PDF and ePub downloads, according to the available data) and Abstracts Views on Vision4Press platform.
Data correspond to usage on the plateform after 2015. The current usage metrics is available 48-96 hours after online publication and is updated daily on week days.
Initial download of the metrics may take a while.