Fig. 5
Download original image
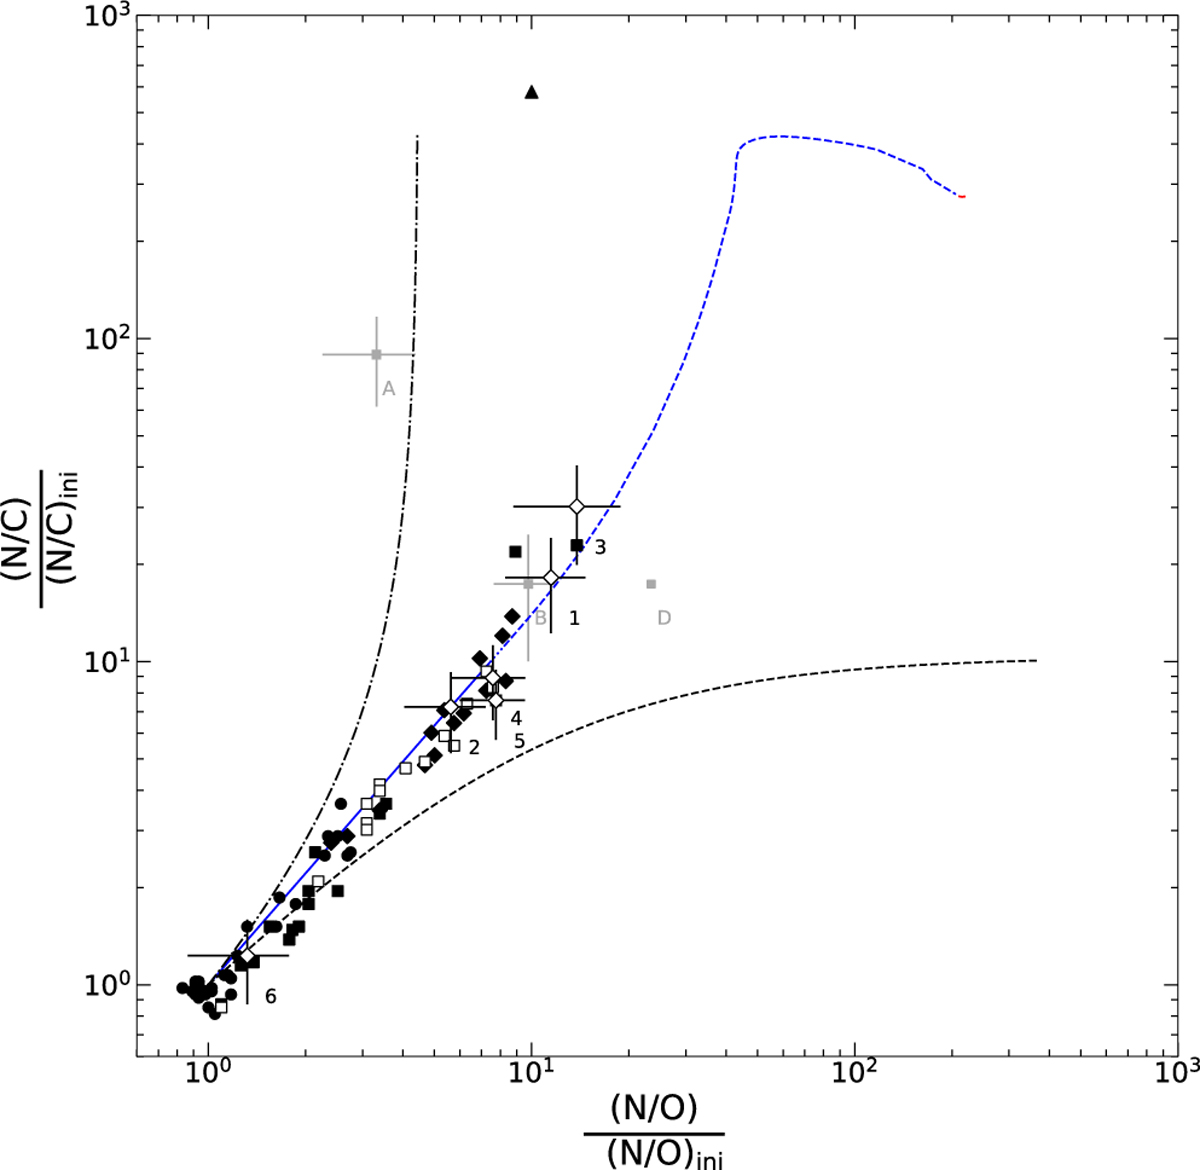
Nitrogen-to-carbon ratio versus nitrogen-to-oxygen ratio, normalised to initial values. Objects from the present work are shown (open diamonds, marked by their ID#) and from previous work employing an analysis methodology similar to the present one: B-type main-sequence stars (Nieva & Simón-Díaz 2011; Nieva & Przybilla 2012, black dots), BA-type supergiants (Przybilla et al. 2010, black diamonds), B-type supergiants (Paper I, open squares), late O-type main-sequence stars (Aschenbrenner et al. 2023, black squares), and the stripped CN-cycled core γ Columbæ (Irrgang et al. 2022, black triangle). For comparison, the development of the surface CNO abundances is shown for a 25 M⊙, Ωrot = 0.568 Ωcrit model by Ekström et al. (2012). The colour and style of the line depicts the different (main) evolution stages: ZAMS until TAMS (solid blue), further development until beginning of core He-burning (dotted blue), until core He exhaustion (dashed blue), and carbon-burning (red, at the very end of the track). The dashed black and dash-dotted lines depict the analytical boundaries for the ON- and CN-cycle, respectively (cf. Fig. 1 of Maeder et al. 2014). The grey squares are solutions for Sher 25 from the literature (see Sect. 6). Their error bars are from standard errors of the mean CNO abundances, while error bars for results from the present work represent 1σ standard deviations.
Current usage metrics show cumulative count of Article Views (full-text article views including HTML views, PDF and ePub downloads, according to the available data) and Abstracts Views on Vision4Press platform.
Data correspond to usage on the plateform after 2015. The current usage metrics is available 48-96 hours after online publication and is updated daily on week days.
Initial download of the metrics may take a while.