Fig. 4
Download original image
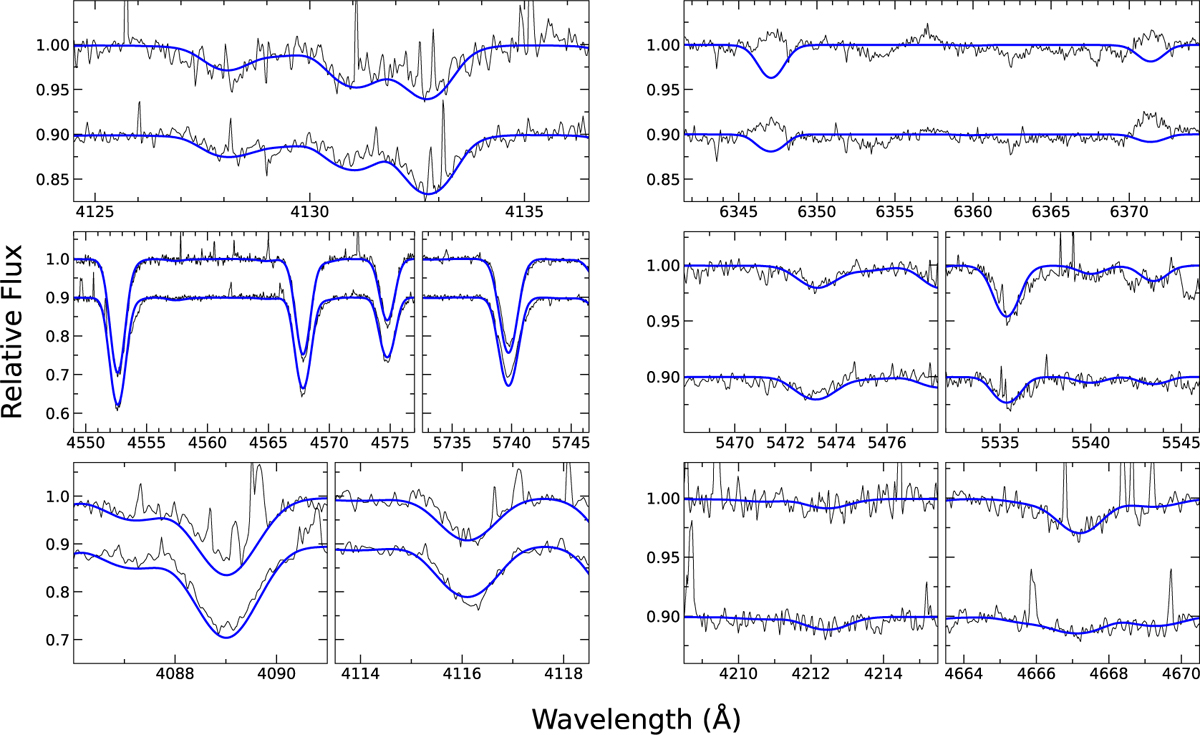
Comparison of best-fitting models (blue) for observed spectra (black) of HD 13854 and HD 14956 (upper and lower lines in each sub-panel). The three rows show lines of different ionisation stages of silicon: Si II λλ4128 and 4130 Å (upper left), Si II λλ6347 and 6371 Å (upper right); the Si III triplet λ4552–4575 Å and Si III 15739 Å (middle left), Si III λλ5473 and 5540 Å (middle right); Si IV λλ4088 and 4116 Å (lower left), Si IV λλ4212 and 4666 Å (lower right panel).
Current usage metrics show cumulative count of Article Views (full-text article views including HTML views, PDF and ePub downloads, according to the available data) and Abstracts Views on Vision4Press platform.
Data correspond to usage on the plateform after 2015. The current usage metrics is available 48-96 hours after online publication and is updated daily on week days.
Initial download of the metrics may take a while.