Fig. 10

Download original image
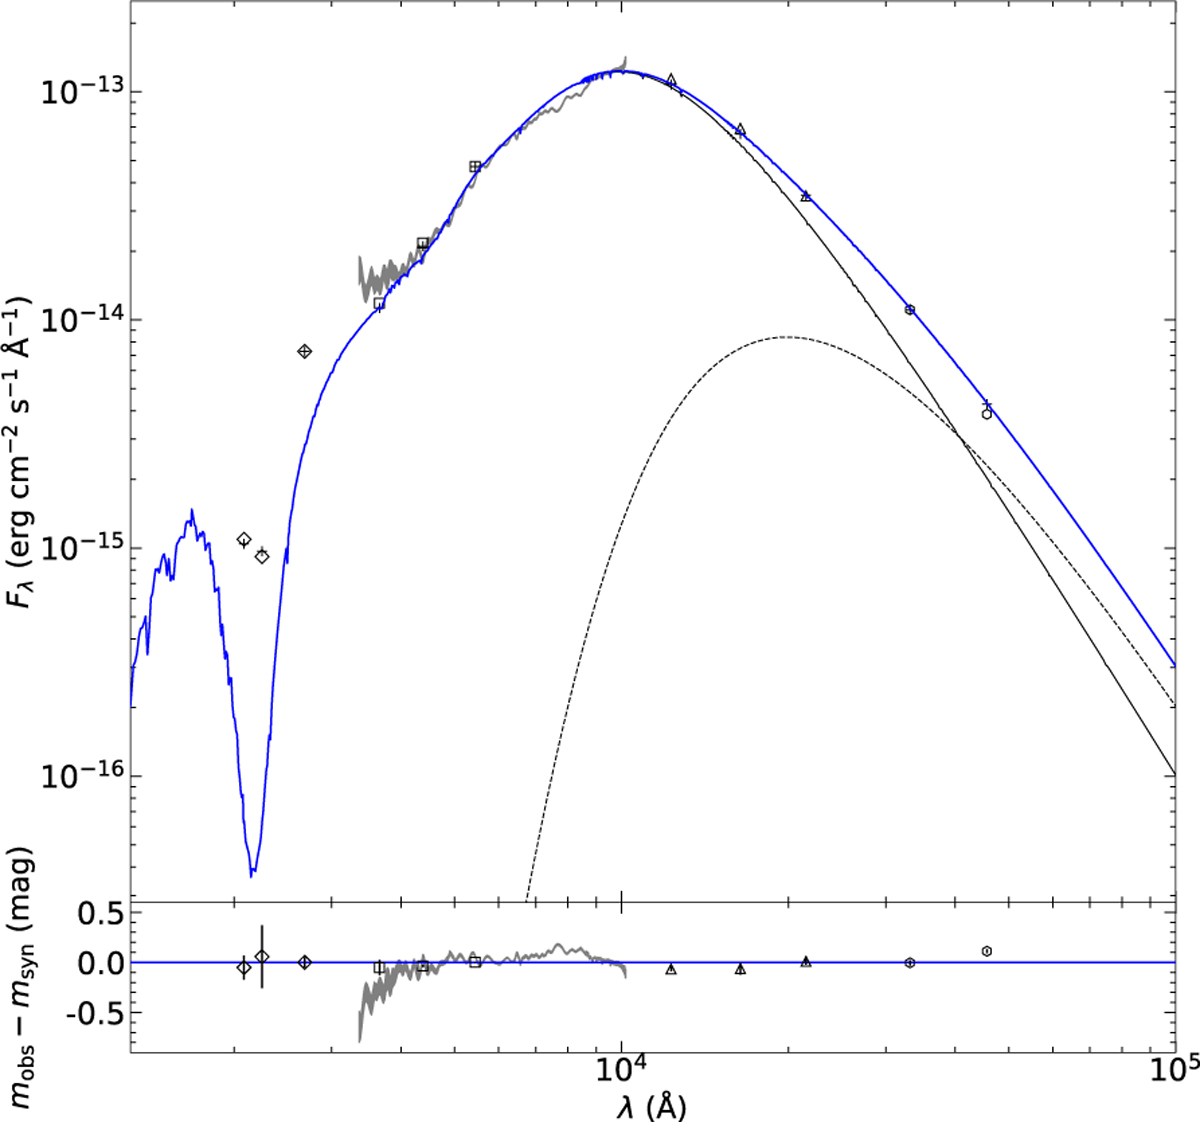
Spectral energy distribution of Sher 25. A comparison of the reddened model flux (solid blue line) to photometric and spectrophotometric measurements (upper panel) and the difference between modelled and observed parameters measured in magnitudes (lower panel) are shown. A blackbody contribution (black dashed line) with a temperature of T = 1800 K is assumed in addition to the stellar SED (black solid line). The grey line depicts Gaia spectrophotometry. Symbol assignment is the same as in Fig. 7. In addition, near-UV Swift/UVOT photometric measurements (diamonds) are shown. Results of synthetic photometry on the model SED in the respective pass bands are also indicated (plus signs). The error bars in the lower panel depict the 1σ uncertainty range.
Current usage metrics show cumulative count of Article Views (full-text article views including HTML views, PDF and ePub downloads, according to the available data) and Abstracts Views on Vision4Press platform.
Data correspond to usage on the plateform after 2015. The current usage metrics is available 48-96 hours after online publication and is updated daily on week days.
Initial download of the metrics may take a while.


