Fig. 8
Download original image
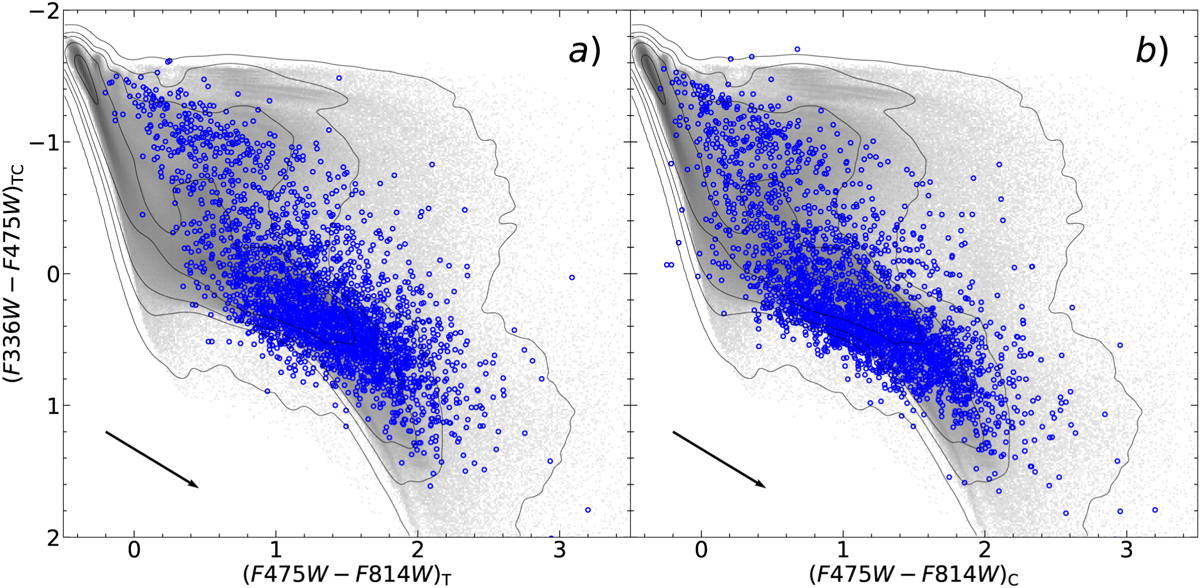
Two-colour diagrams showing star clusters from Paper I and this study over-plotted on the distributions of models. The models of clusters (areas of grey colour) are with masses from 102 to 105 M⊙. The subscript TC indicates that colour index is based on T and C aperture photometry in panels a and b, respectively. Arrows indicate extinction vectors of AV = 1, assuming the standard Milky Way extinction law.
Current usage metrics show cumulative count of Article Views (full-text article views including HTML views, PDF and ePub downloads, according to the available data) and Abstracts Views on Vision4Press platform.
Data correspond to usage on the plateform after 2015. The current usage metrics is available 48-96 hours after online publication and is updated daily on week days.
Initial download of the metrics may take a while.