Fig. 2
Download original image
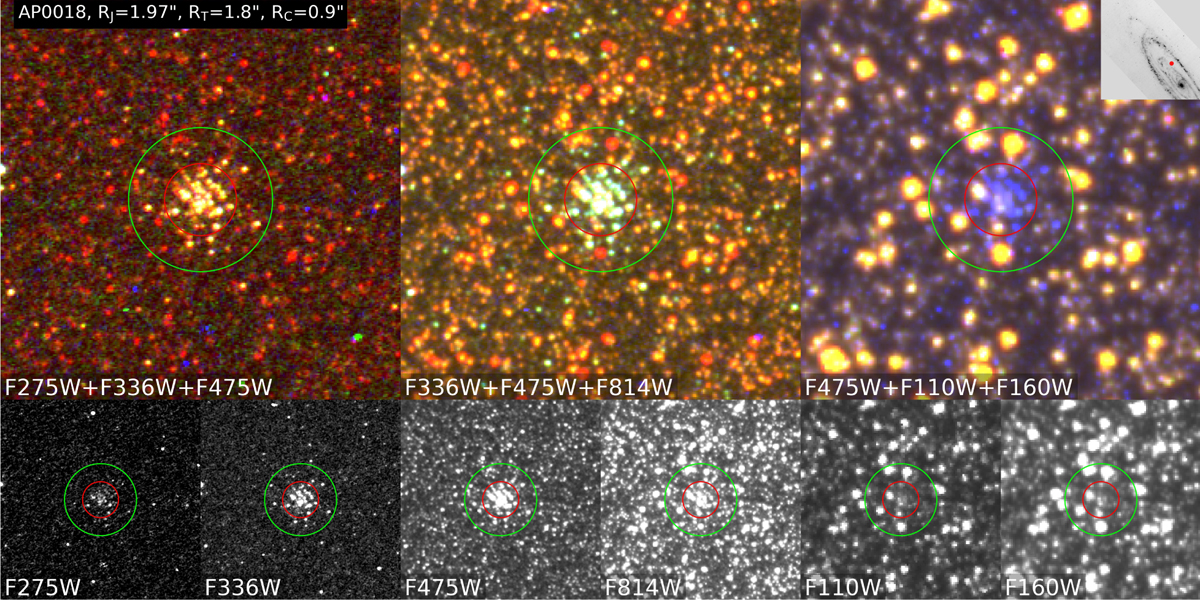
Images of the cluster AP0018 in colour panels (top) produced by combining three passbands and grey-scale panels (bottom) produced from individual passband frames (passbands are labelled inside the panels). Green and red circles mark T and C apertures, respectively. The size of each panel is 10" × 10". An insert at the top-right corner indicates the location of the cluster in M 31. North is up and east is to the left.
Current usage metrics show cumulative count of Article Views (full-text article views including HTML views, PDF and ePub downloads, according to the available data) and Abstracts Views on Vision4Press platform.
Data correspond to usage on the plateform after 2015. The current usage metrics is available 48-96 hours after online publication and is updated daily on week days.
Initial download of the metrics may take a while.