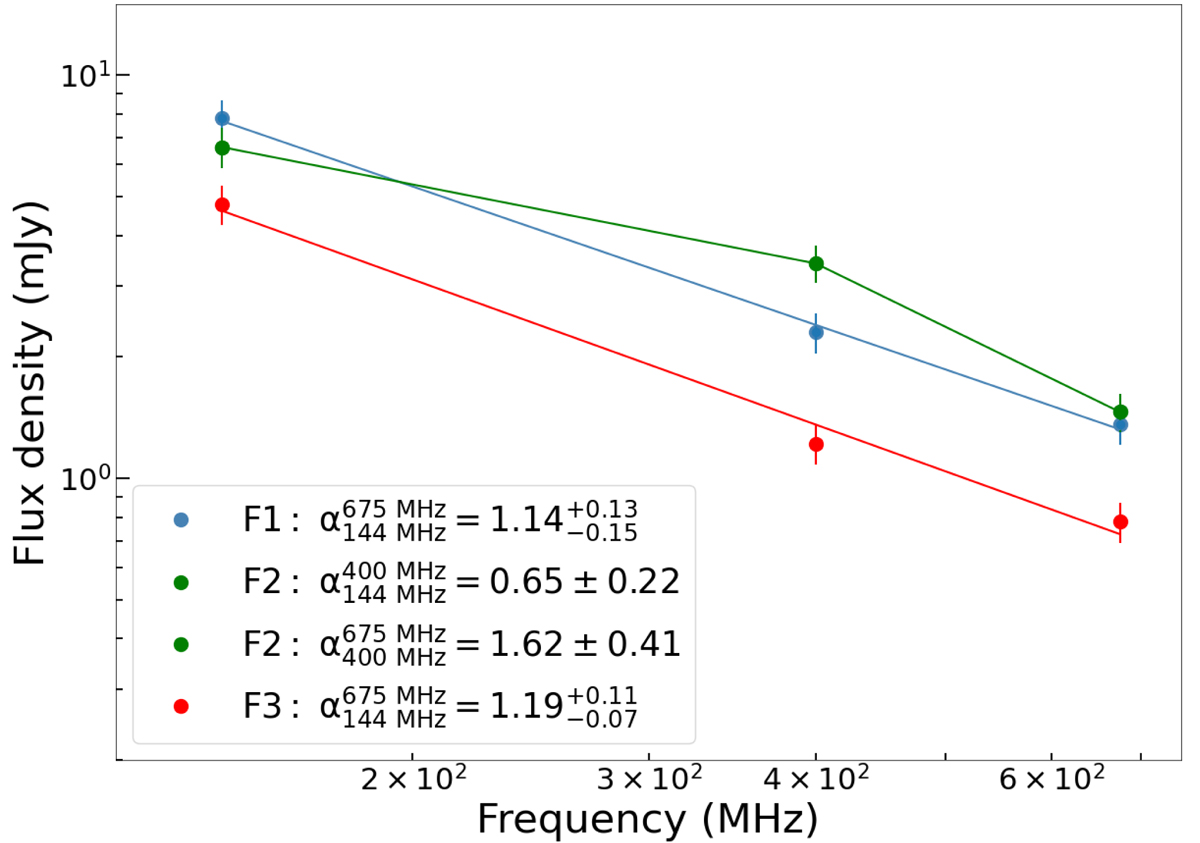
Fig. 9.

Download original image
Spectra of the three filaments detected in the high-resolution images. We have added two best-fit power laws for filaments F1 and F3; the spectrum of filament F2 is not consistent with a power law due to the spectral steepening. For this reason, we have measured the spectral index by linking the three flux density values. The legend is shown in the bottom-left corner along with the spectral index value.
Current usage metrics show cumulative count of Article Views (full-text article views including HTML views, PDF and ePub downloads, according to the available data) and Abstracts Views on Vision4Press platform.
Data correspond to usage on the plateform after 2015. The current usage metrics is available 48-96 hours after online publication and is updated daily on week days.
Initial download of the metrics may take a while.


