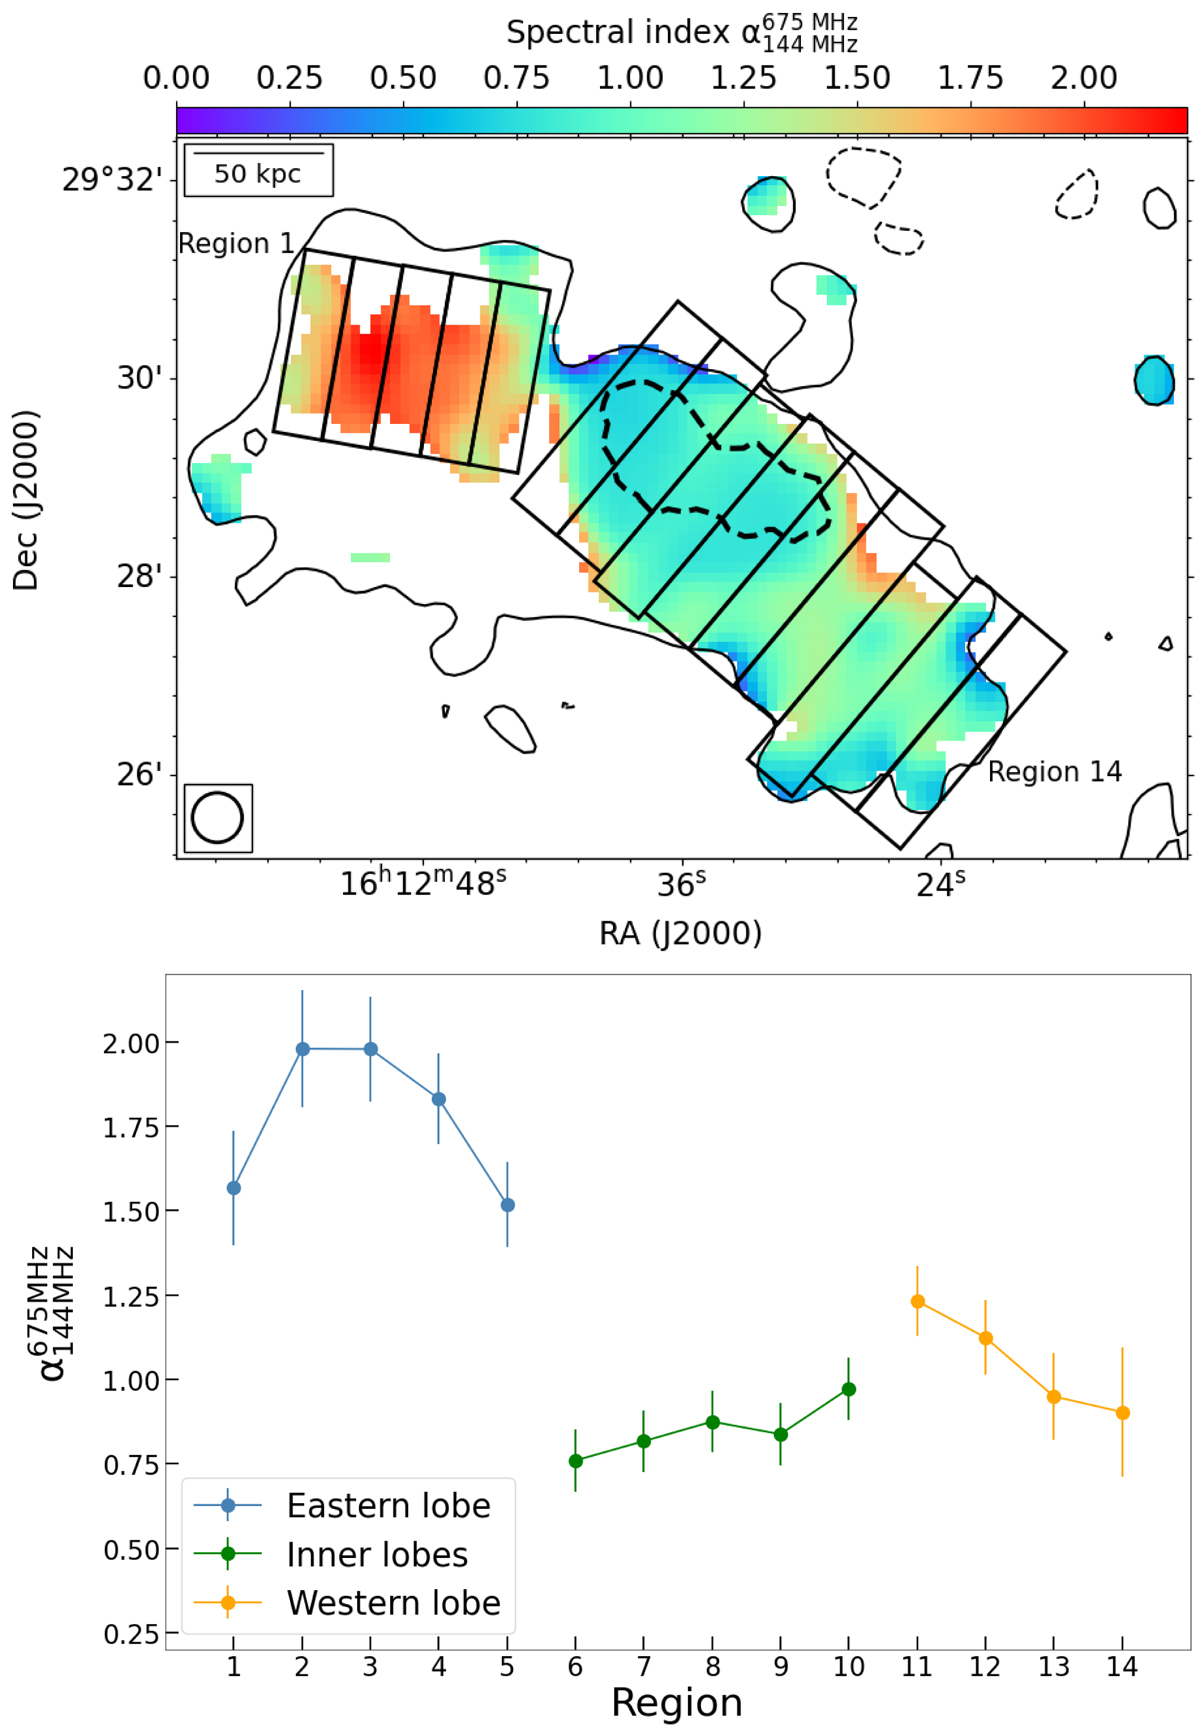
Fig. 8.
Download original image
Analysis of the spectral index trend across the outer and the inner lobes of NGC 6086. Top: NGC 6086 spectral index map between 144 MHz and 675 MHz at low resolution (30 arcsec). Contours show the LOFAR emission and are drawn at (−3, 3)×σ. The dotted black line is the inner lobes region, defined by the 3σ contour of the VLA 4700 MHz and used as a reference. 14 regions across the entire source are selected in the map to look for spectral index trends. The beam is shown in the bottom-left corner and a reference scale in the top-left one. The error map is presented in Fig. A.4. Bottom: spectral index values of the 14 regions. We colour-coded the three main regions of the large-scale diffuse emission detected in the low-resolution images.
Current usage metrics show cumulative count of Article Views (full-text article views including HTML views, PDF and ePub downloads, according to the available data) and Abstracts Views on Vision4Press platform.
Data correspond to usage on the plateform after 2015. The current usage metrics is available 48-96 hours after online publication and is updated daily on week days.
Initial download of the metrics may take a while.