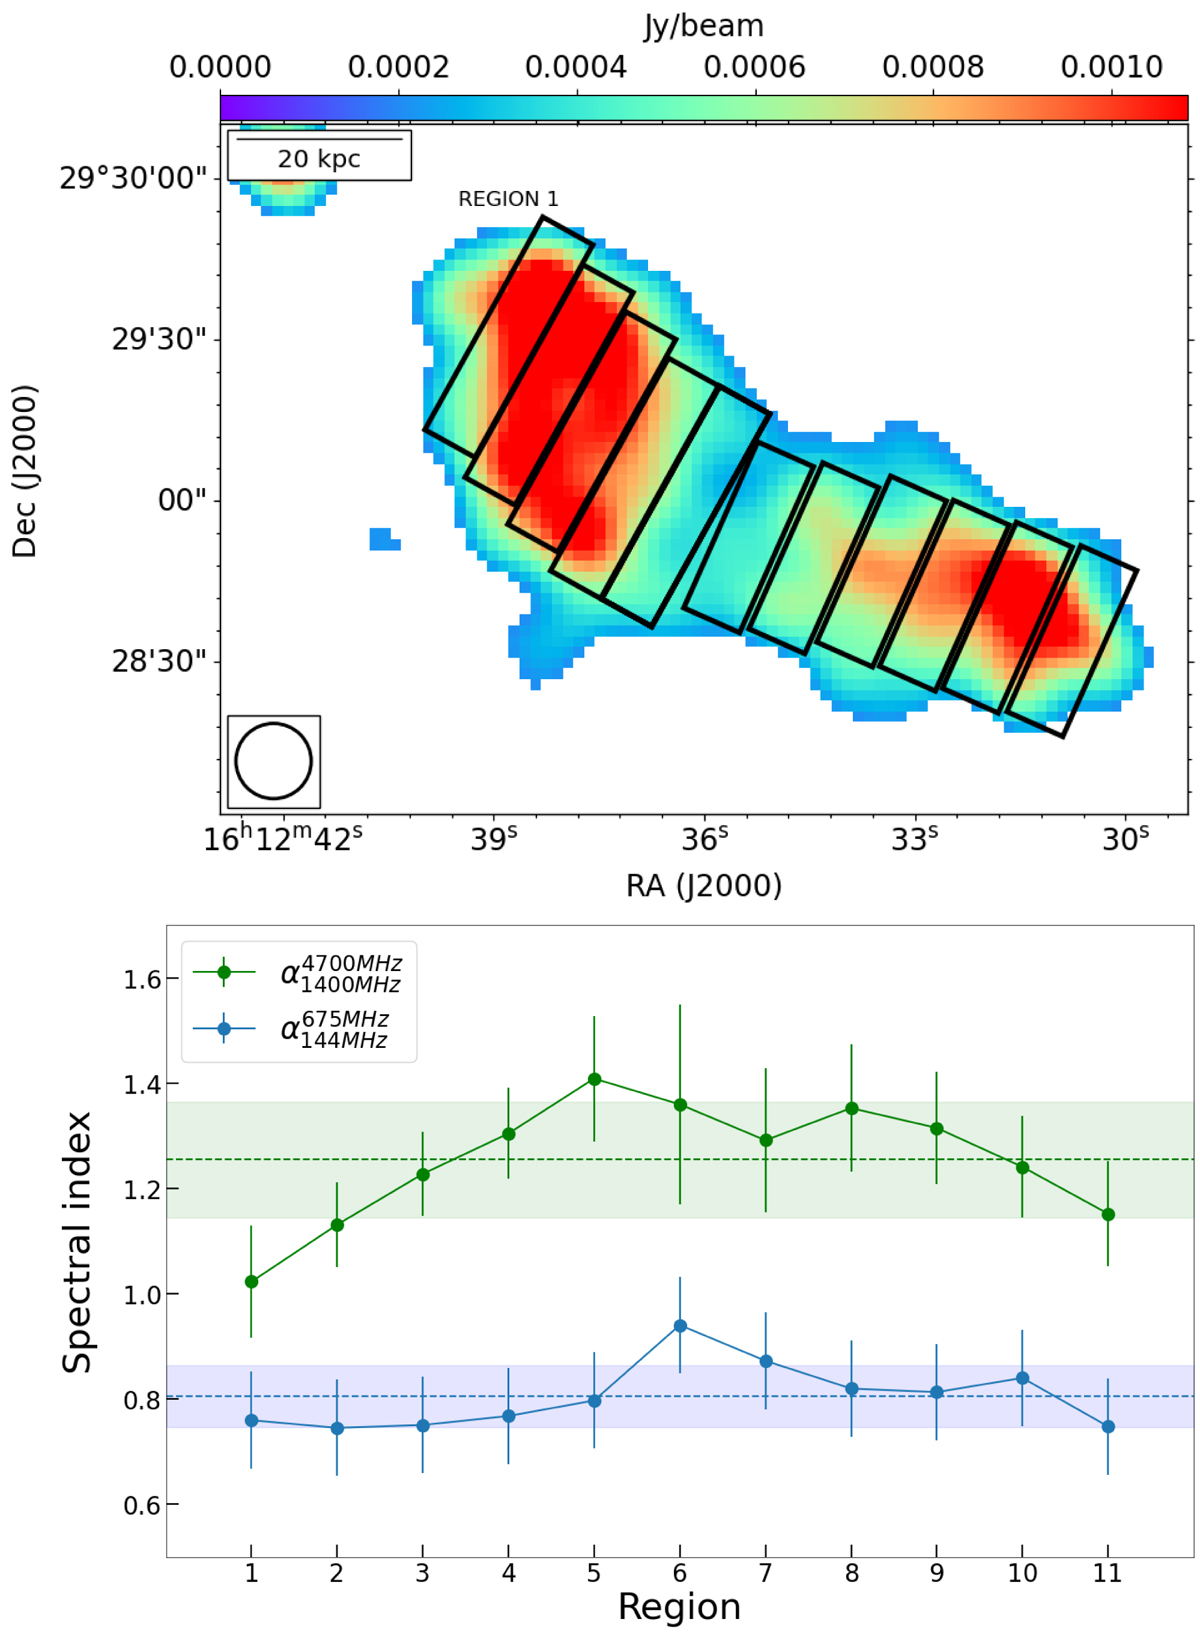
Fig. 6.
Download original image
Analysis of the spectral index trend within the inner lobes of NGC 6086. Top: inner lobes of the source at 14 arcsec resolution at 4700 MHz above the 3σ threshold. The 11 regions larger than a beam that are used for the spectral index analysis are overlaid. The beam is shown in the bottom-left corner, and a reference scale is shown in the top-left one. Bottom: spectral index profile of the inner lobes in the two frequency ranges: 144–675 MHz and 1400–4700 MHz. The dashed lines represent the mean values, while the coloured regions represent the standard deviations from the mean values.
Current usage metrics show cumulative count of Article Views (full-text article views including HTML views, PDF and ePub downloads, according to the available data) and Abstracts Views on Vision4Press platform.
Data correspond to usage on the plateform after 2015. The current usage metrics is available 48-96 hours after online publication and is updated daily on week days.
Initial download of the metrics may take a while.