Fig. 5.
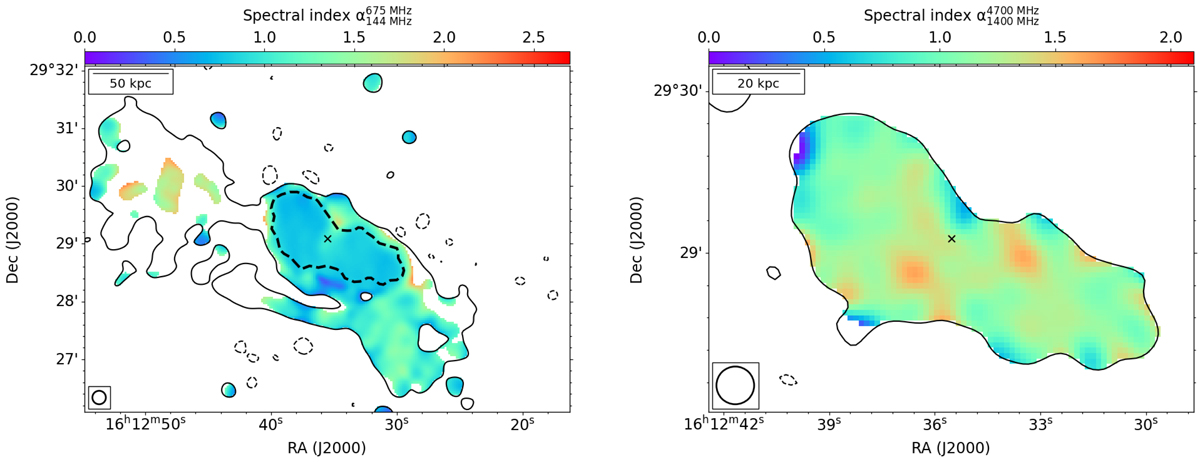
Download original image
NGC 6086 spectral index maps at a resolution of 14 arcsec. The beam is shown in the bottom-left corner, a reference scale is in the top-left one, and the black ‘×’ marker is used to underline the location of the host galaxy. Left panel: spectral index map between 144 and 400 MHz overlaid with 3σ LOFAR contours. The black dotted line region is the 4700 MHz 3σ contour and is used as a reference for the inner lobes. Right panel: spectral index map between 1400 MHz and 4700 MHz, with VLA 4700 MHz 3σ contours overlaid. The associated error maps at low and high frequencies are shown in Fig. A.3.
Current usage metrics show cumulative count of Article Views (full-text article views including HTML views, PDF and ePub downloads, according to the available data) and Abstracts Views on Vision4Press platform.
Data correspond to usage on the plateform after 2015. The current usage metrics is available 48-96 hours after online publication and is updated daily on week days.
Initial download of the metrics may take a while.