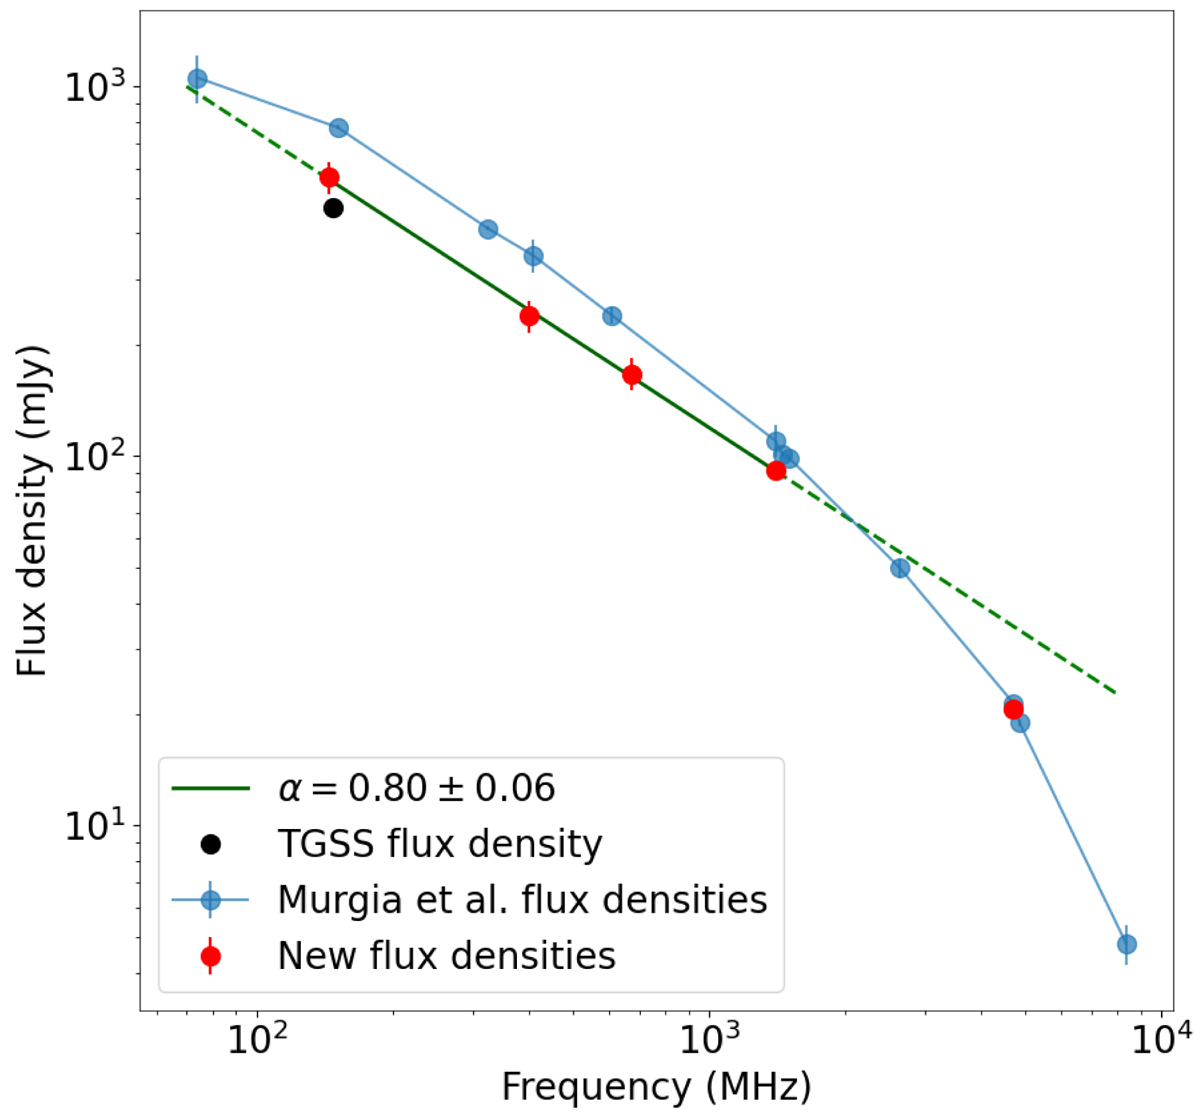
Fig. 4.

Download original image
Integrated radio spectrum of the inner lobes of NGC 6086. Red circles show the flux density measurements presented in this paper, blue circles show the flux densities listed in Murgia et al. (2011) connected without fitting, and the black point is the flux density measured by the TGSS all-sky survey of the GMRT at 147 MHz and 25 arcsec of resolution (Intema et al. 2017). The green line represents the best linear fit using the values in the range 144–1400 MHz (with dashed extensions to emphasise the spectrum curvature and difference with respect to the literature flux density values). The best-fit spectral index is shown in the legend.
Current usage metrics show cumulative count of Article Views (full-text article views including HTML views, PDF and ePub downloads, according to the available data) and Abstracts Views on Vision4Press platform.
Data correspond to usage on the plateform after 2015. The current usage metrics is available 48-96 hours after online publication and is updated daily on week days.
Initial download of the metrics may take a while.


