Fig. 3.
Download original image
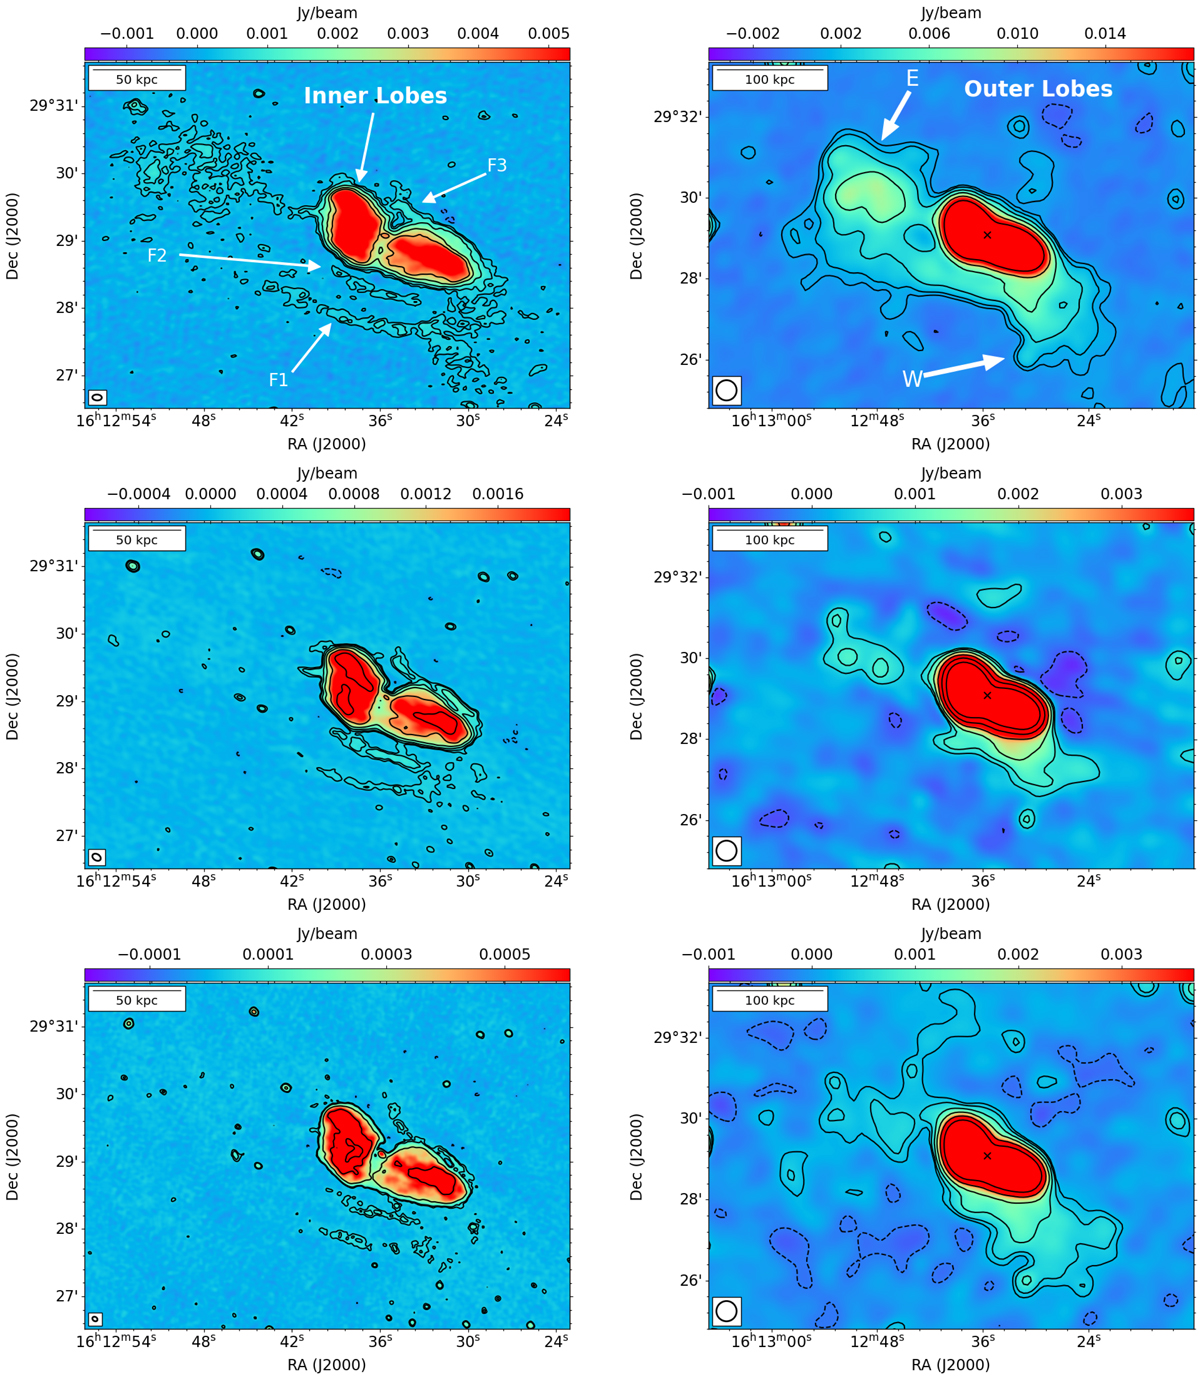
Radio images of the source NGC 6086 at 144 MHz (top row), 400 MHz (central row), and 675 MHz (bottom row). The left column shows images at the highest resolution (8.37 × 5.22, 8 × 5.5, 4.8 × 3.7 arcsec, from the top to the bottom panel, respectively) and the right column at low resolution (30 arcsec). Contours are drawn at (−3, 3, 5, 10, 20, 30) × σ in the first panel; (−3, 3, 5, 20, 50) × σ in the fifth panel; and (−3, 3, 5, 10, 20, 40, 80) × σ in the other panels. The ‘×’ markers in the panels in the right column indicate the position of the host galaxy. The beam is shown in the bottom-left corner, and a reference physical scale is shown in the top-left one.
Current usage metrics show cumulative count of Article Views (full-text article views including HTML views, PDF and ePub downloads, according to the available data) and Abstracts Views on Vision4Press platform.
Data correspond to usage on the plateform after 2015. The current usage metrics is available 48-96 hours after online publication and is updated daily on week days.
Initial download of the metrics may take a while.