Fig. A.4.
Download original image
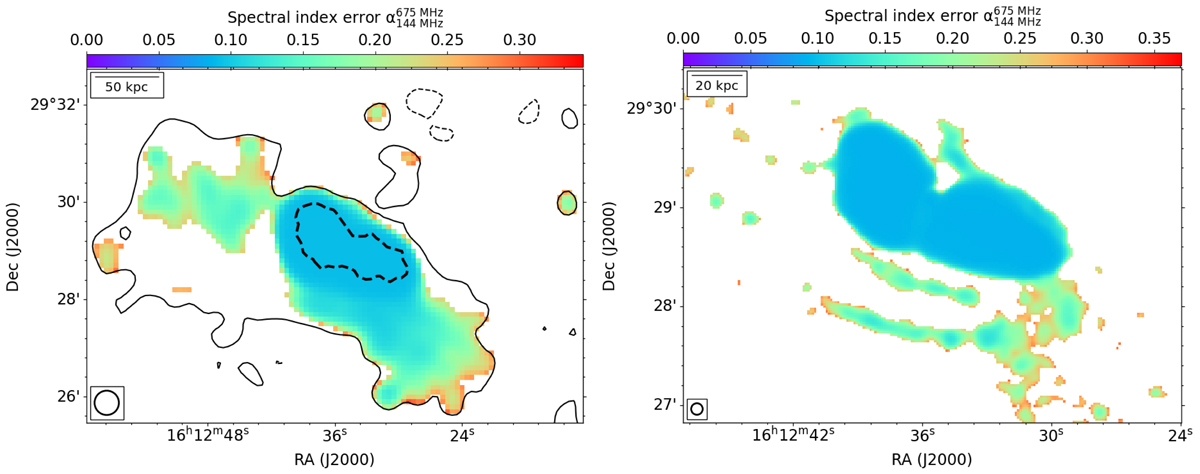
NGC 6086 error value associated with the spectral index map at different resolutions between 144 and 675 MHz. Left: NGC 6086 error value associated with the spectral index map at 30 arcsec. Contours show the LOFAR emission and are drawn at 3σ. Right: NGC 6086 error value associated with the spectral index map at 7 arcsec. The region is above 3σ for all the frequencies. The beam is shown in the bottom-left corner, and a reference physical scale is shown in the top-left corner.
Current usage metrics show cumulative count of Article Views (full-text article views including HTML views, PDF and ePub downloads, according to the available data) and Abstracts Views on Vision4Press platform.
Data correspond to usage on the plateform after 2015. The current usage metrics is available 48-96 hours after online publication and is updated daily on week days.
Initial download of the metrics may take a while.