Fig. 5.
Download original image
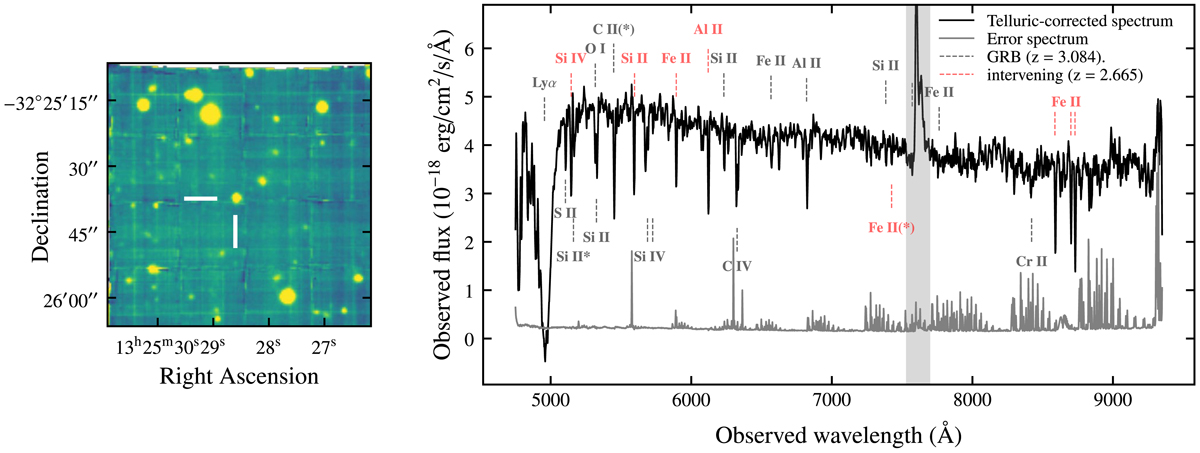
MUSE spectroscopy of GRB 220627A. Left: white light image resulting from the final MUSE data cube. The GRB afterglow is clearly visible at the centre of the image. Right: telluric-corrected spectrum (black) and error spectrum (grey) of GRB 220627A extracted from the MUSE data cube using an aperture with a radius of 0.6″. We show identified absorption lines at the GRB redshift (z = 3.084) and the intervening system (z = 2.665) in grey and red, respectively. The vertical shaded region is heavily affected by telluric lines.
Current usage metrics show cumulative count of Article Views (full-text article views including HTML views, PDF and ePub downloads, according to the available data) and Abstracts Views on Vision4Press platform.
Data correspond to usage on the plateform after 2015. The current usage metrics is available 48-96 hours after online publication and is updated daily on week days.
Initial download of the metrics may take a while.