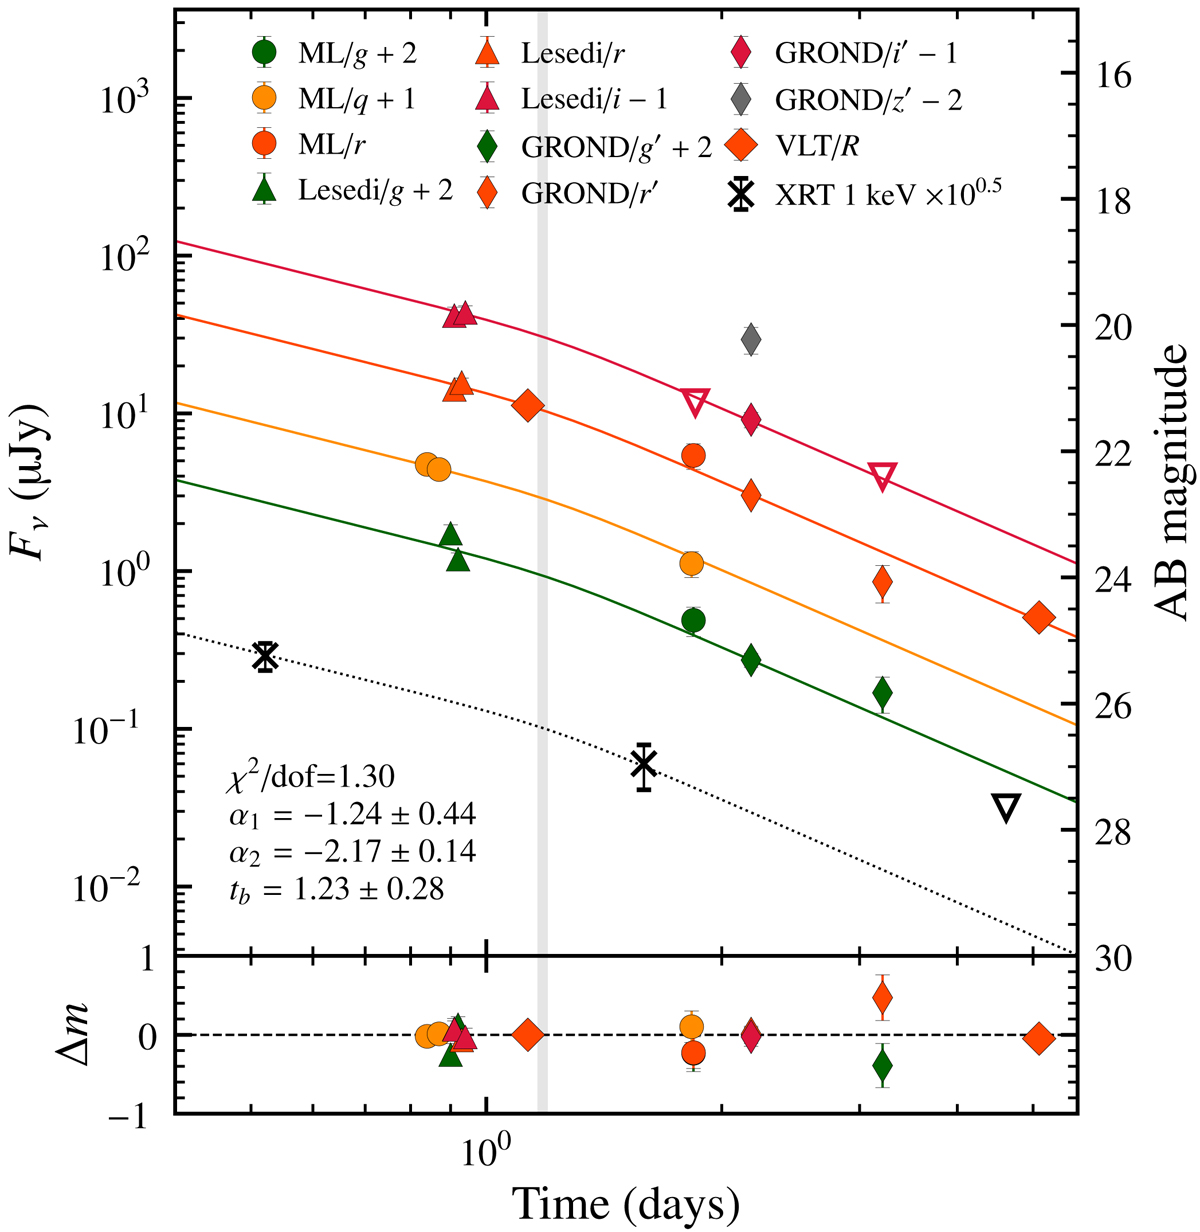
Fig. 4.
Download original image
X-ray and optical light curves associated with GRB 220627A, organised by observing band and instrument. MeerLICHT is abbreviated to ML in the legend. The vertical grey region denotes the time of the MUSE spectroscopic observations. We show the broken power law fits to each of the g, q, r and i bands, where the break time and temporal indices were constrained to be the same across each fit. Residuals are shown in magnitudes in the lower panel. We show the two X-ray detections as crosses and the single upper limit as an upside-down triangle. The dotted line is the optical light curve fit shifted vertically to the X-ray band.
Current usage metrics show cumulative count of Article Views (full-text article views including HTML views, PDF and ePub downloads, according to the available data) and Abstracts Views on Vision4Press platform.
Data correspond to usage on the plateform after 2015. The current usage metrics is available 48-96 hours after online publication and is updated daily on week days.
Initial download of the metrics may take a while.