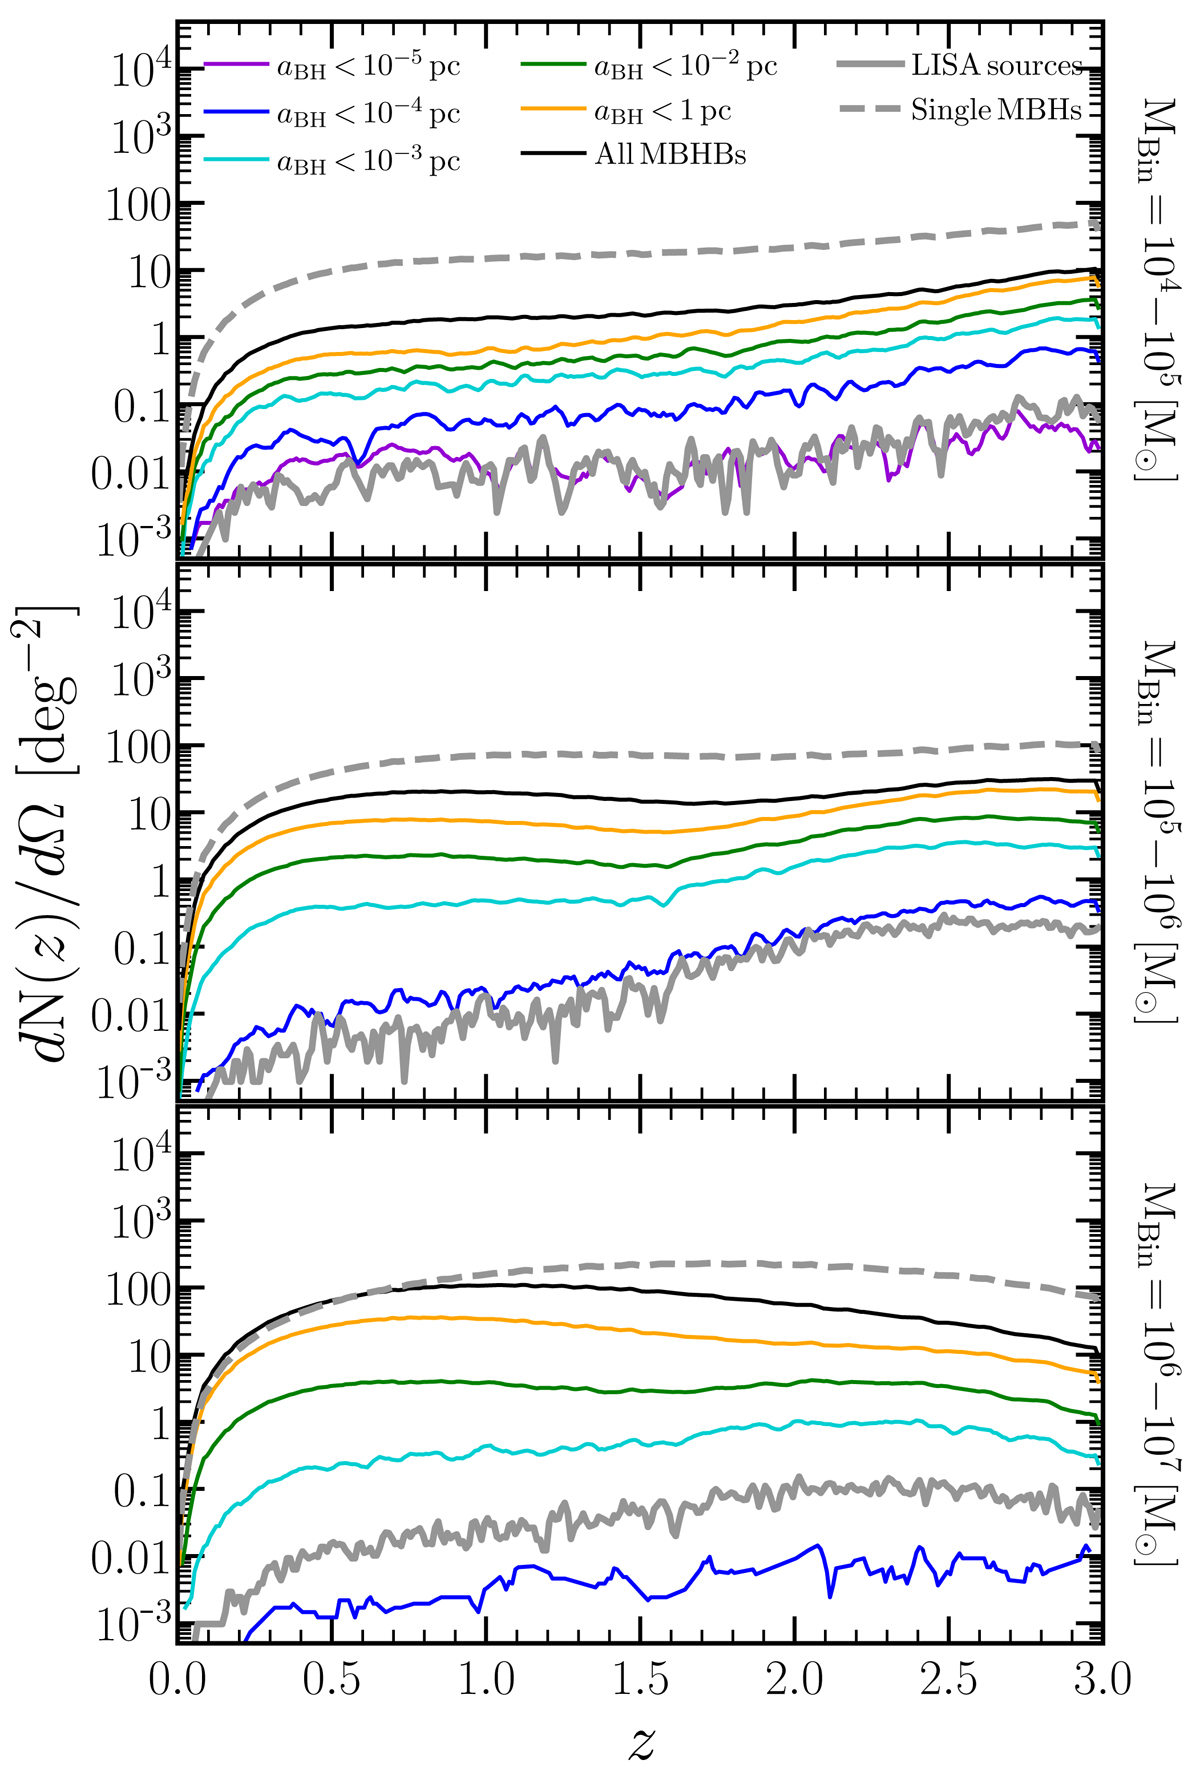
Fig. 5.
Download original image
Number of hard MBHBs (grey solid) and single MBHs (grey dashed) per deg2 (dN(z)/dΩ, black) as a function of redshift. Different colors represent the same but when the population of MBHBs is divided by semi-major axis (aBH). Each panel corresponds to binaries with different total masses: 104 − 105 M⊙ (top), 105 − 106 M⊙ (middle), and 106 − 107 M⊙ (bottom). Overall, the figure shows that LISA MBHBs represent 0.1%−1% of the MBHs between 104 and 107 M⊙.
Current usage metrics show cumulative count of Article Views (full-text article views including HTML views, PDF and ePub downloads, according to the available data) and Abstracts Views on Vision4Press platform.
Data correspond to usage on the plateform after 2015. The current usage metrics is available 48-96 hours after online publication and is updated daily on week days.
Initial download of the metrics may take a while.