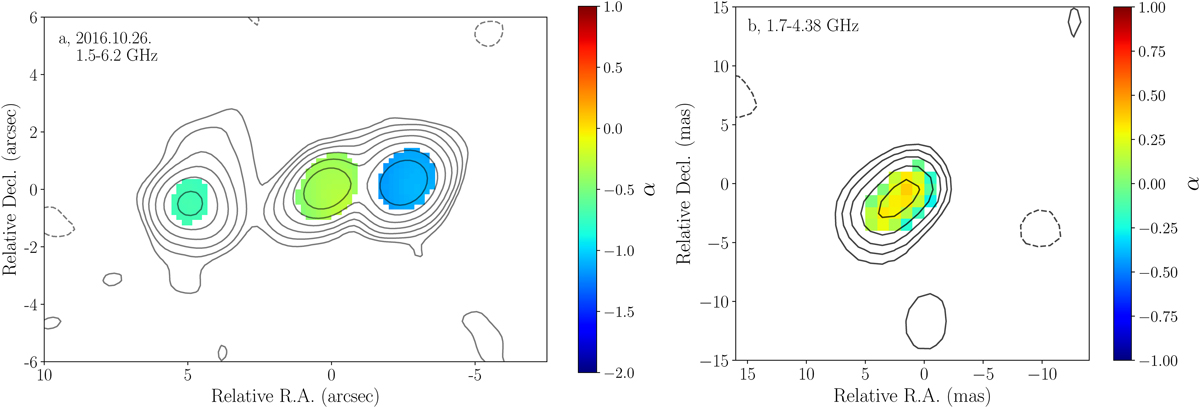
Fig. 4.
Download original image
Two-point spectral index distribution maps of PSO J334 based on: a quasi-simultaneous VLA images at 1.5 and 6.2 GHz, and b 1.7-GHz EVN and 4.38-GHz VLBA images. The lowest contours are at 0.12 and 0.14 mJy beam−1, and contour levels increase by a factor of two. Colors represent spectral index values. We note that the VLBI images were taken half a year apart, so flux density variability cannot be excluded and therefore the spectral index map in panel b should be treated with caution.
Current usage metrics show cumulative count of Article Views (full-text article views including HTML views, PDF and ePub downloads, according to the available data) and Abstracts Views on Vision4Press platform.
Data correspond to usage on the plateform after 2015. The current usage metrics is available 48-96 hours after online publication and is updated daily on week days.
Initial download of the metrics may take a while.