Open Access
Fig. 2.
Download original image
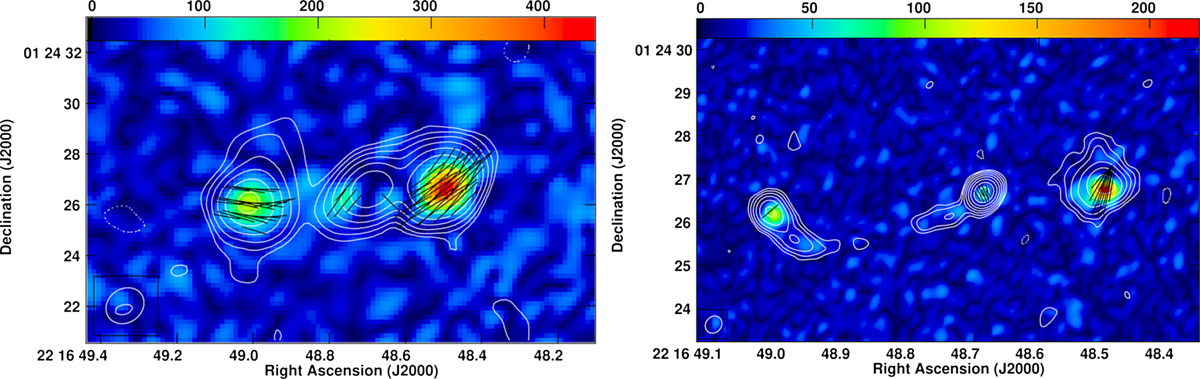
VLA 1.5 GHz (left panel) and 6.2 GHz (right panel) polarimetric images of PSO J334. The colors represent the polarized intensity in μJy beam−1, while the contours are the same as in the total intensity map in Fig. 1. EVPAs are represented by the black ticks in the image.
Current usage metrics show cumulative count of Article Views (full-text article views including HTML views, PDF and ePub downloads, according to the available data) and Abstracts Views on Vision4Press platform.
Data correspond to usage on the plateform after 2015. The current usage metrics is available 48-96 hours after online publication and is updated daily on week days.
Initial download of the metrics may take a while.