Open Access
Fig. 8
Download original image
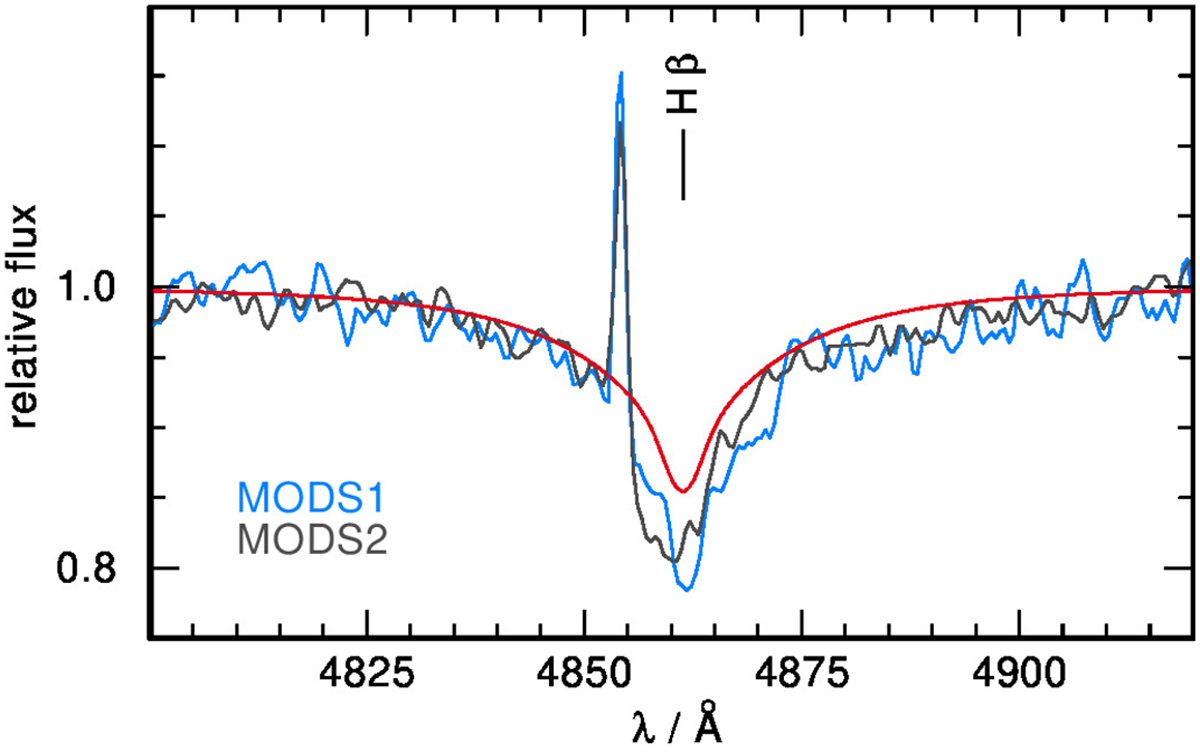
LBT/MODS1 (blue) and MODS2 (gray) spectra of the DAe: WD WDJ064527.28+565916.90 taken simultaneously and overplotted with the best fit TMAP model (red). The origin of the emission line located on the blue wing of Hβ remains unclear. No emission lines are visible at the other Balmer line members.
Current usage metrics show cumulative count of Article Views (full-text article views including HTML views, PDF and ePub downloads, according to the available data) and Abstracts Views on Vision4Press platform.
Data correspond to usage on the plateform after 2015. The current usage metrics is available 48-96 hours after online publication and is updated daily on week days.
Initial download of the metrics may take a while.