Fig. 6
Download original image
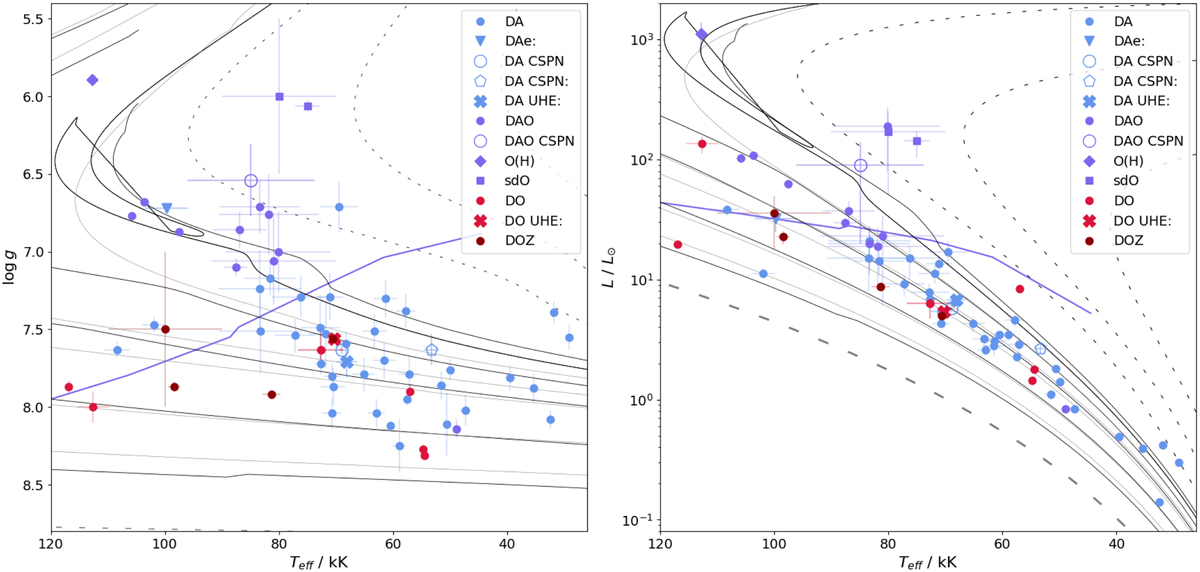
Locations of our targets in the Kiel diagram (left) and HRD (right). The black dashed and solid lines are stellar evolutionary tracks for He-, CO-core WD, respectively (Renedo et al. 2010; Hall et al. 2013), corresponding to masses of 0.306, 0.378, 0.452, 0.524, 0.570, 0.632, 0.767, and 0.934 M⊙. The gray solid lines are VLTP post-AGB evolutionary tracks form Althaus et al. (2009) for masses of 0.514, 0.565, 0.609, 0.741, and 0.869 M⊙. The gray, thick, dashed line is a 1.10 M⊙ H-deficient ONe-Core WD track from Camisassa et al. (2019). The purple solid line indicates where the He abundances should have decreased down to log(He/H) = −3 according to predictions of Unglaub & Bues (2000).
Current usage metrics show cumulative count of Article Views (full-text article views including HTML views, PDF and ePub downloads, according to the available data) and Abstracts Views on Vision4Press platform.
Data correspond to usage on the plateform after 2015. The current usage metrics is available 48-96 hours after online publication and is updated daily on week days.
Initial download of the metrics may take a while.