Open Access
Fig. 2
Download original image
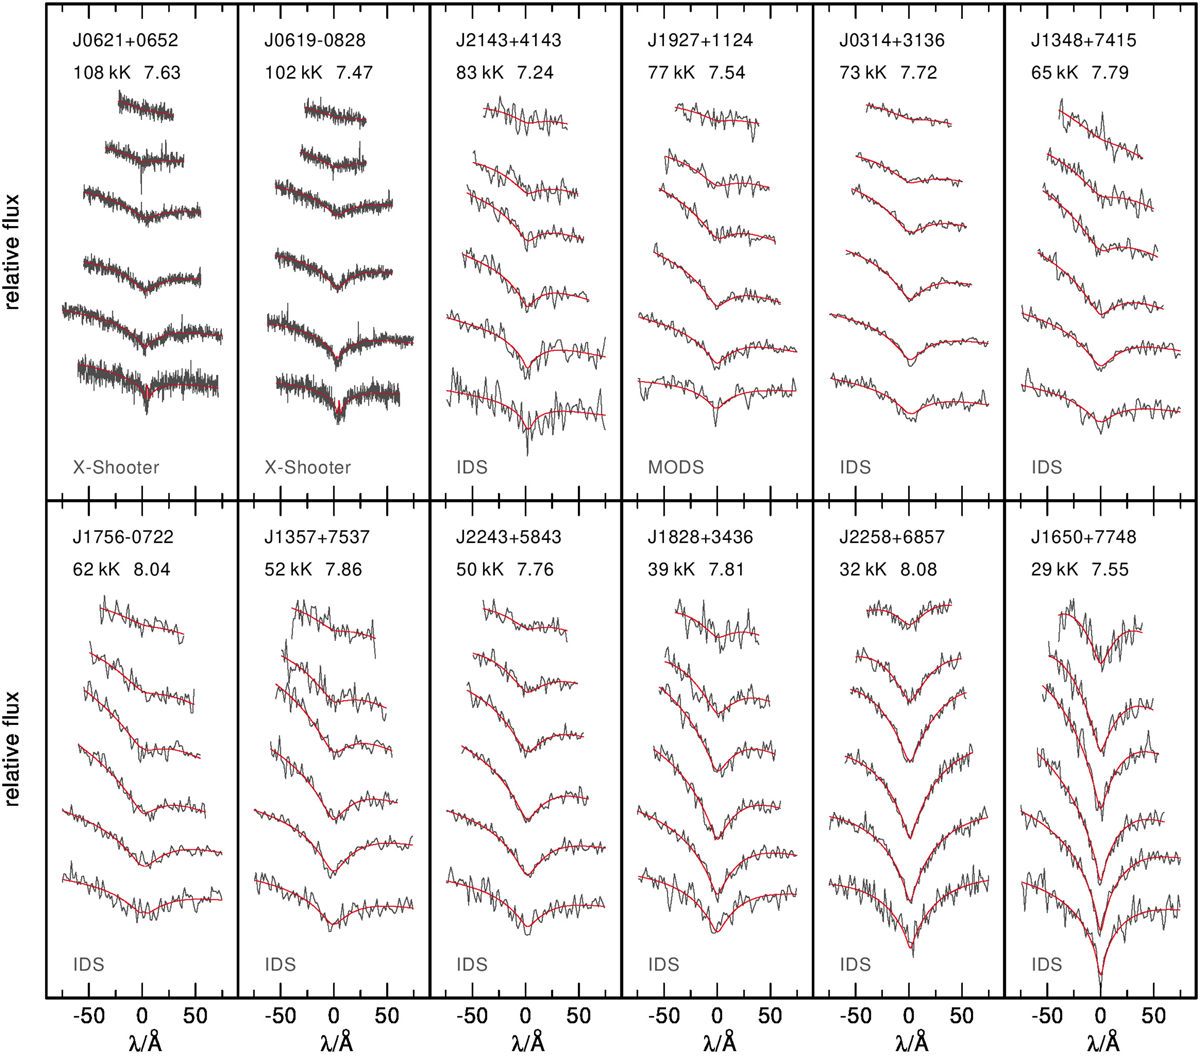
Fits to the Balmer lines (H ζ to H α, from top to bottom) of some of our DA WDs, overplotted with the best fit TMAP models (red). The names of the stars, the derived effective temperatures and surface gravities as well as the spectrograph used for the observations are indicated.
Current usage metrics show cumulative count of Article Views (full-text article views including HTML views, PDF and ePub downloads, according to the available data) and Abstracts Views on Vision4Press platform.
Data correspond to usage on the plateform after 2015. The current usage metrics is available 48-96 hours after online publication and is updated daily on week days.
Initial download of the metrics may take a while.