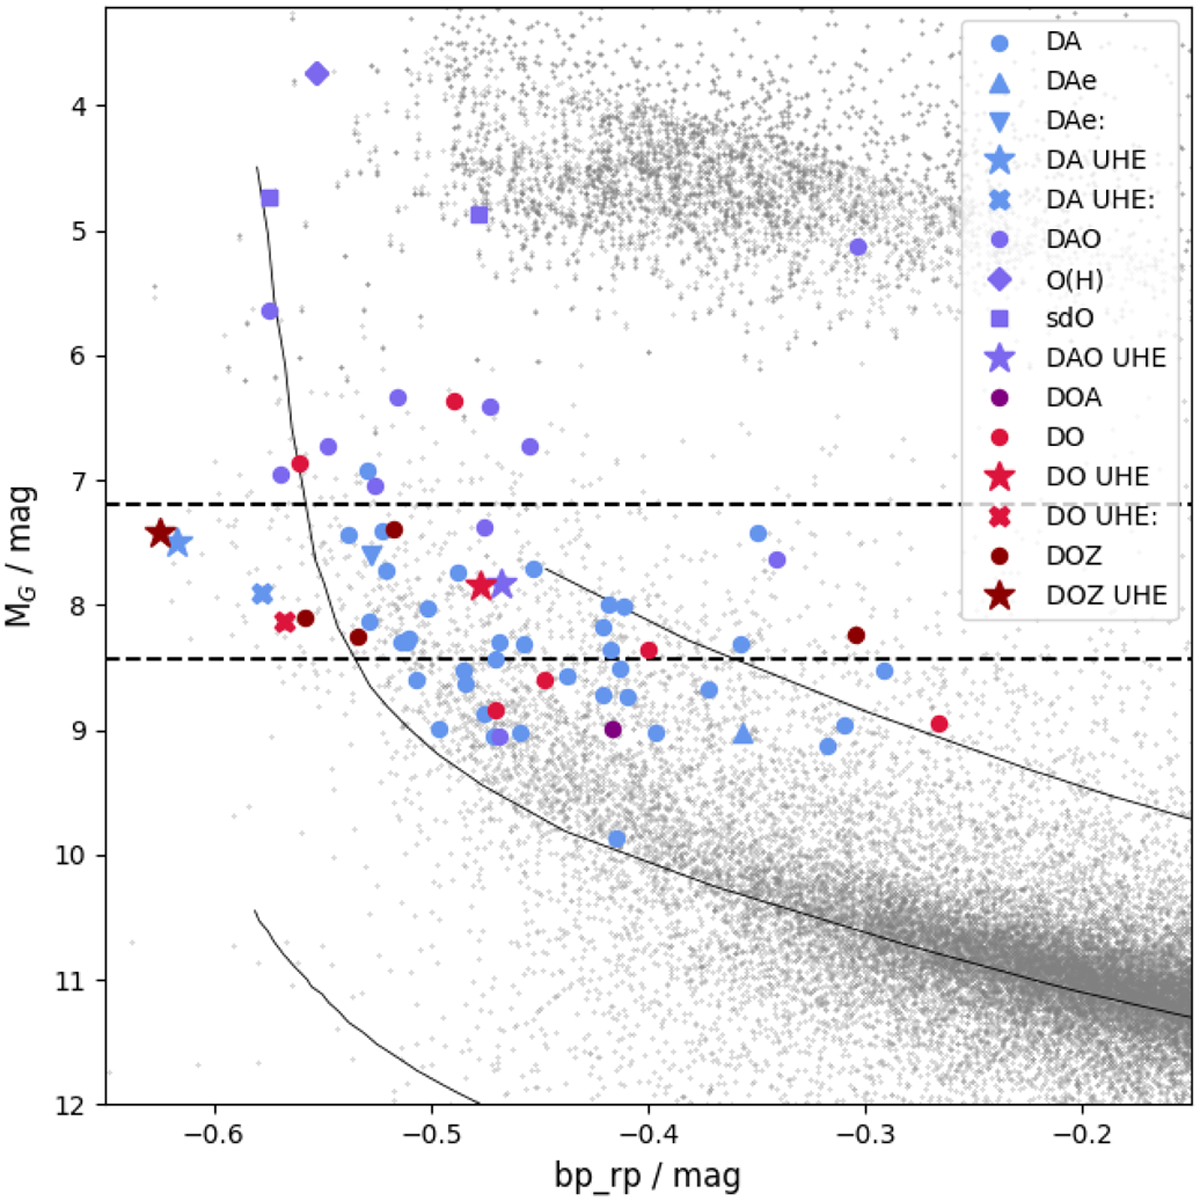
Fig. 1
Download original image
Locations of our targets in the Gaia CMD. Hot subdwarf and WD candidates from Culpan et al. (2022) and Gentile Fusillo et al. (2021), respectively, that have parallaxes better than 10% are shown in gray. The dashed lines indicate the absolute Gaia magnitude region in which the UHE phenomenon occurs as uncovered by Reindl et al. (2021). The thin solid lines correspond to Montreal WD cooling tracks for WD masses of 0.2 (top right), 0.6 (middle), and 1.3 M⊙ (bottom left).
Current usage metrics show cumulative count of Article Views (full-text article views including HTML views, PDF and ePub downloads, according to the available data) and Abstracts Views on Vision4Press platform.
Data correspond to usage on the plateform after 2015. The current usage metrics is available 48-96 hours after online publication and is updated daily on week days.
Initial download of the metrics may take a while.