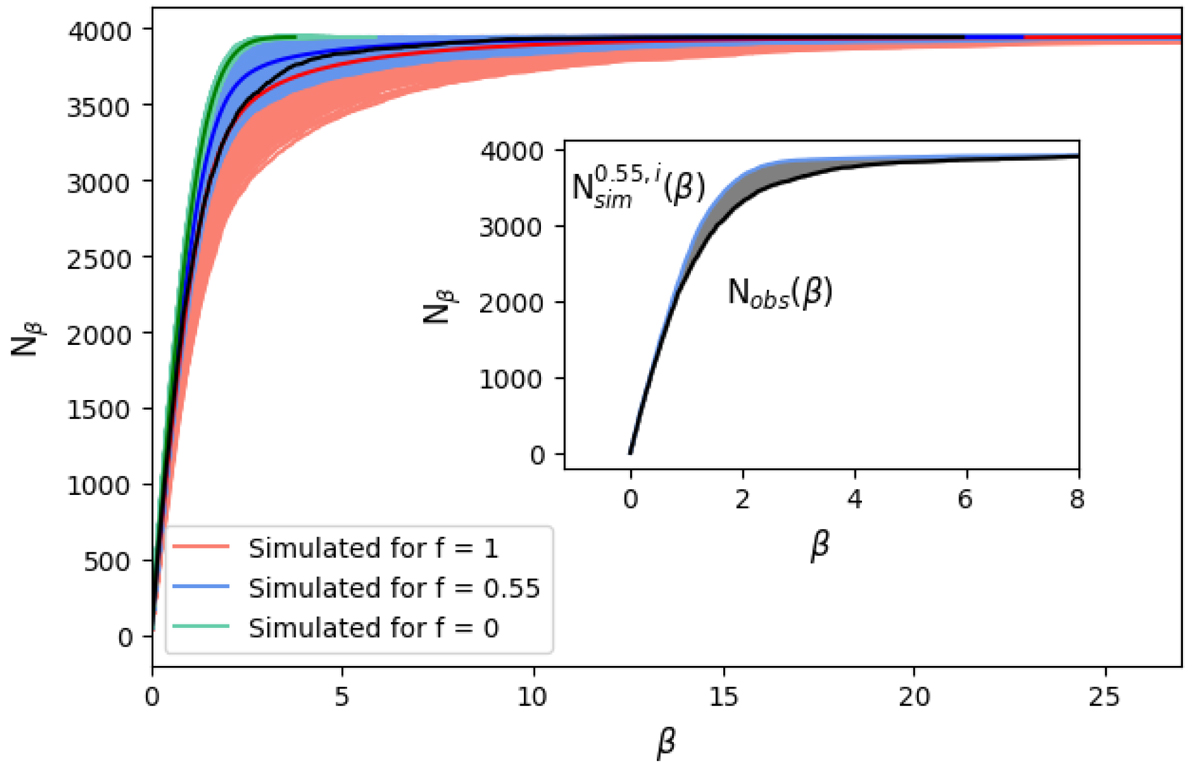
Fig. 6.
Download original image
Cumulative distribution function of β for Sculptor. The black lines show the CDF obtained for Sculptor from the FLAMES dataset; the CDFs from 750 examples of mock datasets for a binary fraction of 0, 0.55 and 1 are shown in green, blue, and salmon respectively. As there is some overlap between the cases of f = 0.55 and f = 1, the median cumulative curve is highlighted in each case with brighter colors and a thicker line-width. Inset: Example for just one simulation, where in gray we highlight the area between the CDF of the simulated case and that for the Sculptor observations, that is what we use when computing the likelihood function.
Current usage metrics show cumulative count of Article Views (full-text article views including HTML views, PDF and ePub downloads, according to the available data) and Abstracts Views on Vision4Press platform.
Data correspond to usage on the plateform after 2015. The current usage metrics is available 48-96 hours after online publication and is updated daily on week days.
Initial download of the metrics may take a while.