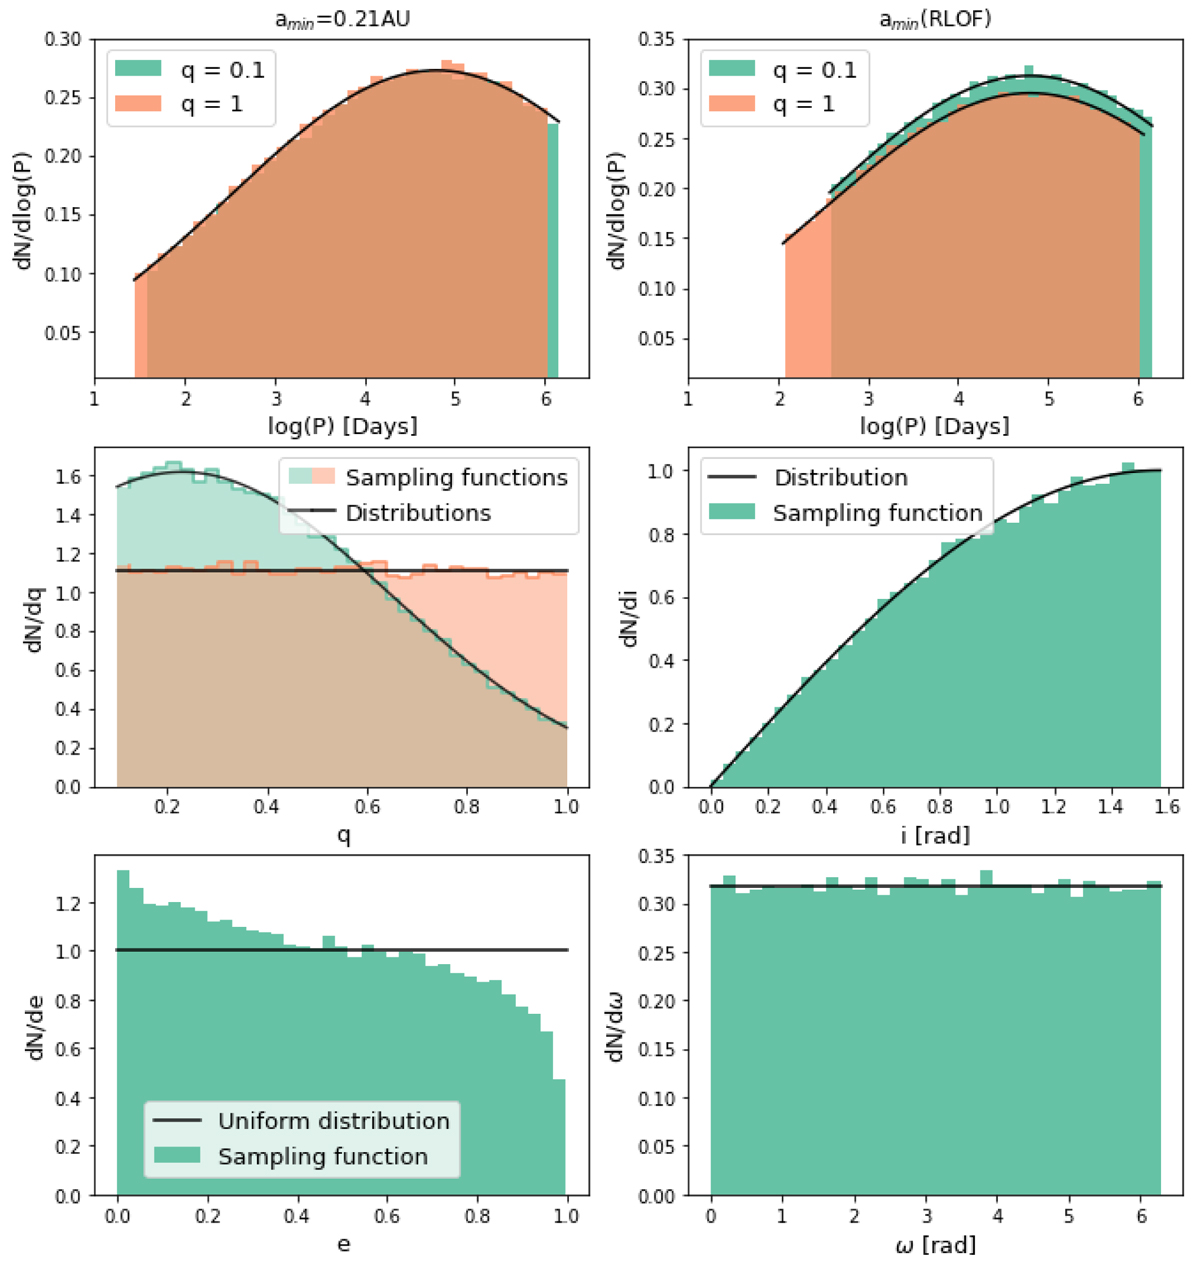
Fig. 5.
Download original image
Probability distribution functions for the parameters defining the properties of the binary star populations. The black lines show the theoretical distributions while the colored histograms show the results of our sampling. Upper panels: period distribution for the two limits in mass-ratios, as indicated by the legend, assuming a constant minimum orbital distance amin = 0.21 AU (left) or the taking into account the RLOF when computing amin (right). The limits for each mass-ratio are plotted with vertical lines. Middle left panel: distributions adopted for the mass ratio (green: GS distribution from Duquennoy & Mayor 1991; salmon: uniform distribution). Middle right panel: distribution of inclinations. Lower left panel: eccentricity distribution; the differences between the uniform theoretical distribution and the one sampled are due to the dependence of e on the semi-minor axis and therefore, the orbital period, as explained in the main text. Lower right panel: distribution of the argument of the periastron.
Current usage metrics show cumulative count of Article Views (full-text article views including HTML views, PDF and ePub downloads, according to the available data) and Abstracts Views on Vision4Press platform.
Data correspond to usage on the plateform after 2015. The current usage metrics is available 48-96 hours after online publication and is updated daily on week days.
Initial download of the metrics may take a while.