Fig. 3.
Download original image
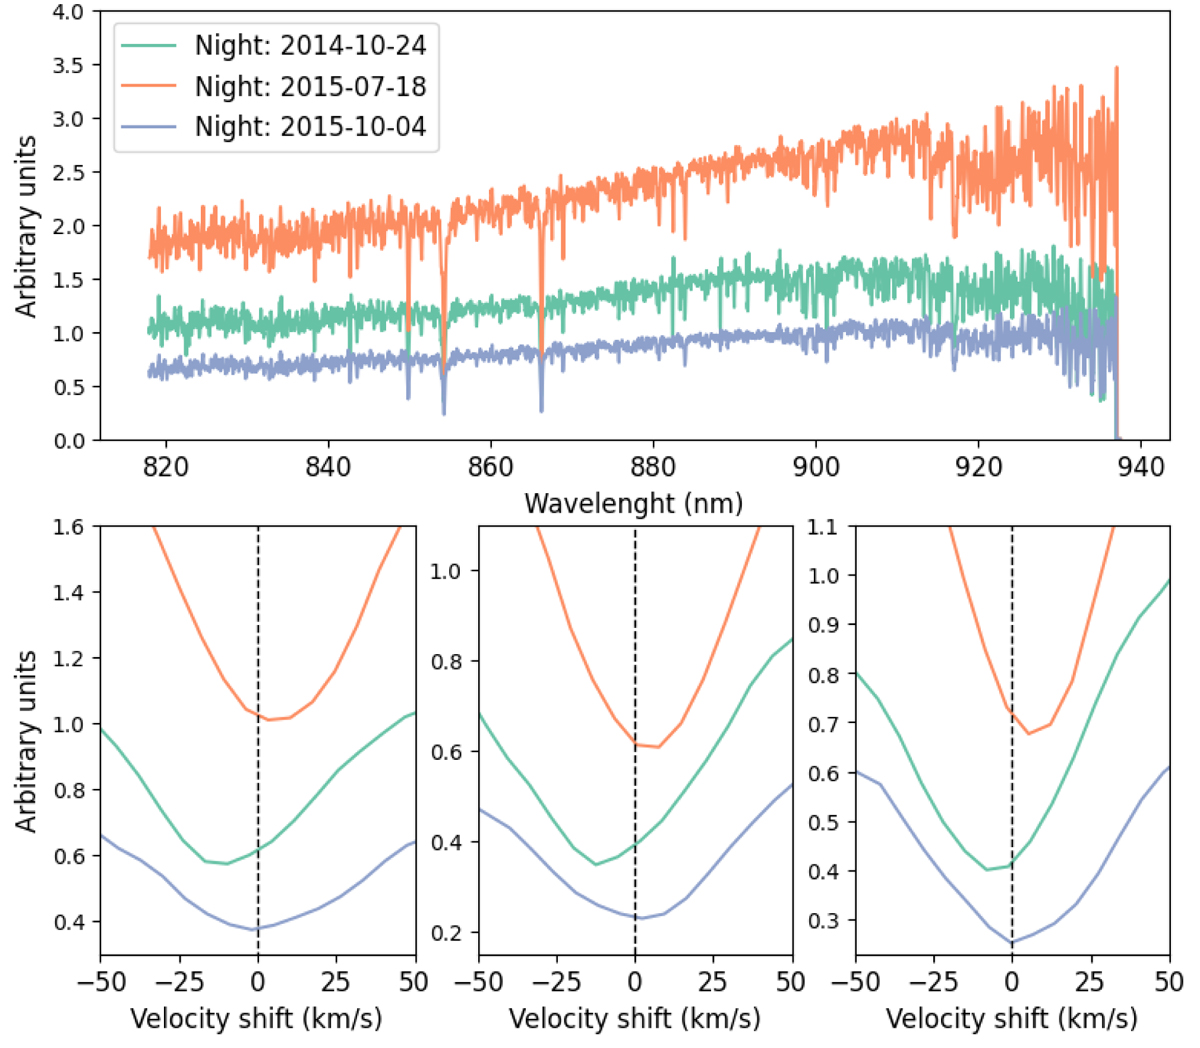
Spectra of an example Sculptor member star, observed during three different nights, as indicated in the legend. The top panel shows the whole spectra. The bottom panels show a zoom-in view of the CaT lines, with the x-axis indicating the velocity shift with respect to the rest wavelength (indicated with dashed lines) of a given CaT line.
Current usage metrics show cumulative count of Article Views (full-text article views including HTML views, PDF and ePub downloads, according to the available data) and Abstracts Views on Vision4Press platform.
Data correspond to usage on the plateform after 2015. The current usage metrics is available 48-96 hours after online publication and is updated daily on week days.
Initial download of the metrics may take a while.