Fig. 14.
Download original image
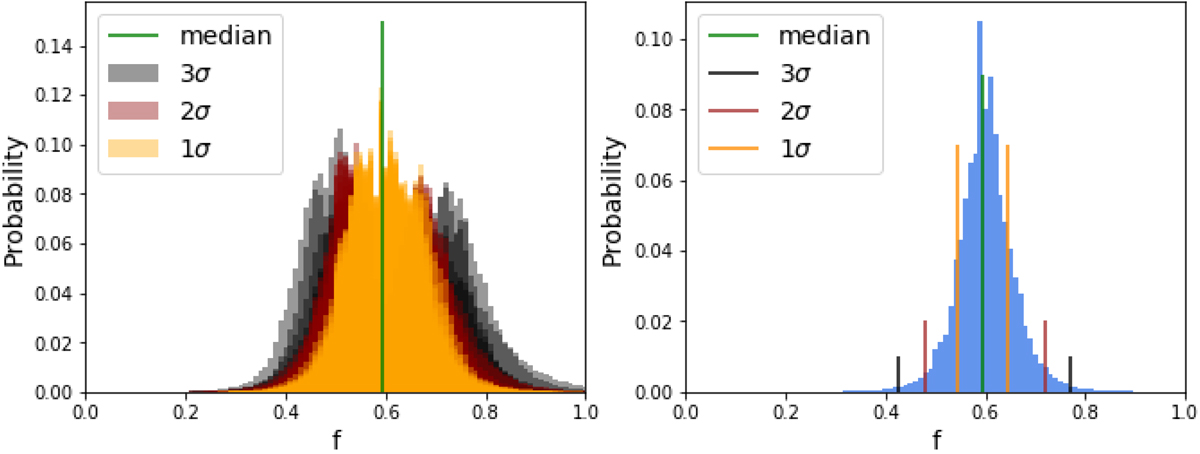
PDFs for simulated WEAVE datasets of Draco. Left panel: PDFs for the 100 simulated WEAVE datasets of Draco (assumed binary fraction f = 0.6) obtained using the new methodology implemented in this work. In orange, we show the cases where the correct binary fraction is obtained within 1σ (69%); in brown within 2σ (21%, up to 90%) and in black those that predict it within 3σ (10%, up to a 100%). The vertical green line indicates the median of the maxima distribution. Right panel: one single PDF of the ones shown in the left panel, this is what we expect to obtain when analyzing the future observational data. Vertical lines indicate the median and intervals of confidence of 1σ, 2σ, and 3σ, as indicated in the labels.
Current usage metrics show cumulative count of Article Views (full-text article views including HTML views, PDF and ePub downloads, according to the available data) and Abstracts Views on Vision4Press platform.
Data correspond to usage on the plateform after 2015. The current usage metrics is available 48-96 hours after online publication and is updated daily on week days.
Initial download of the metrics may take a while.