Fig. 12.
Download original image
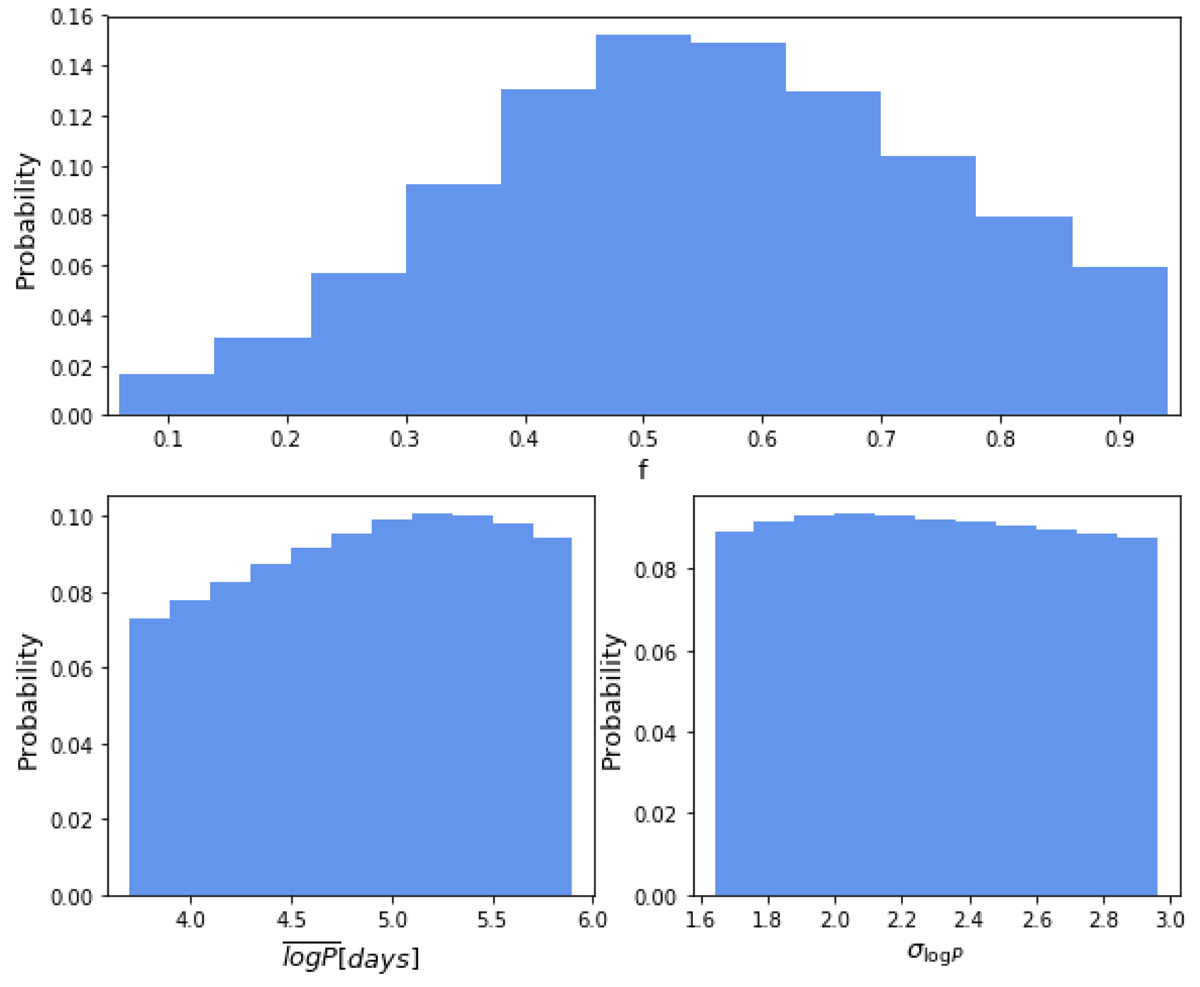
PDFs obtained by summing the colormaps of Fig. 11. Here, each bin correspond to the sum of a whole colormap. In the upper panel, we show the PDF for the binary fraction summing all the distribution of periods simulated. In the lower left panel, the one for ![]() summing all possible binary fractions and σlog P. In the lower right panel, the one for σlog P summing all possible binary fractions and
summing all possible binary fractions and σlog P. In the lower right panel, the one for σlog P summing all possible binary fractions and ![]() .
.
Current usage metrics show cumulative count of Article Views (full-text article views including HTML views, PDF and ePub downloads, according to the available data) and Abstracts Views on Vision4Press platform.
Data correspond to usage on the plateform after 2015. The current usage metrics is available 48-96 hours after online publication and is updated daily on week days.
Initial download of the metrics may take a while.