Fig. 4
Download original image
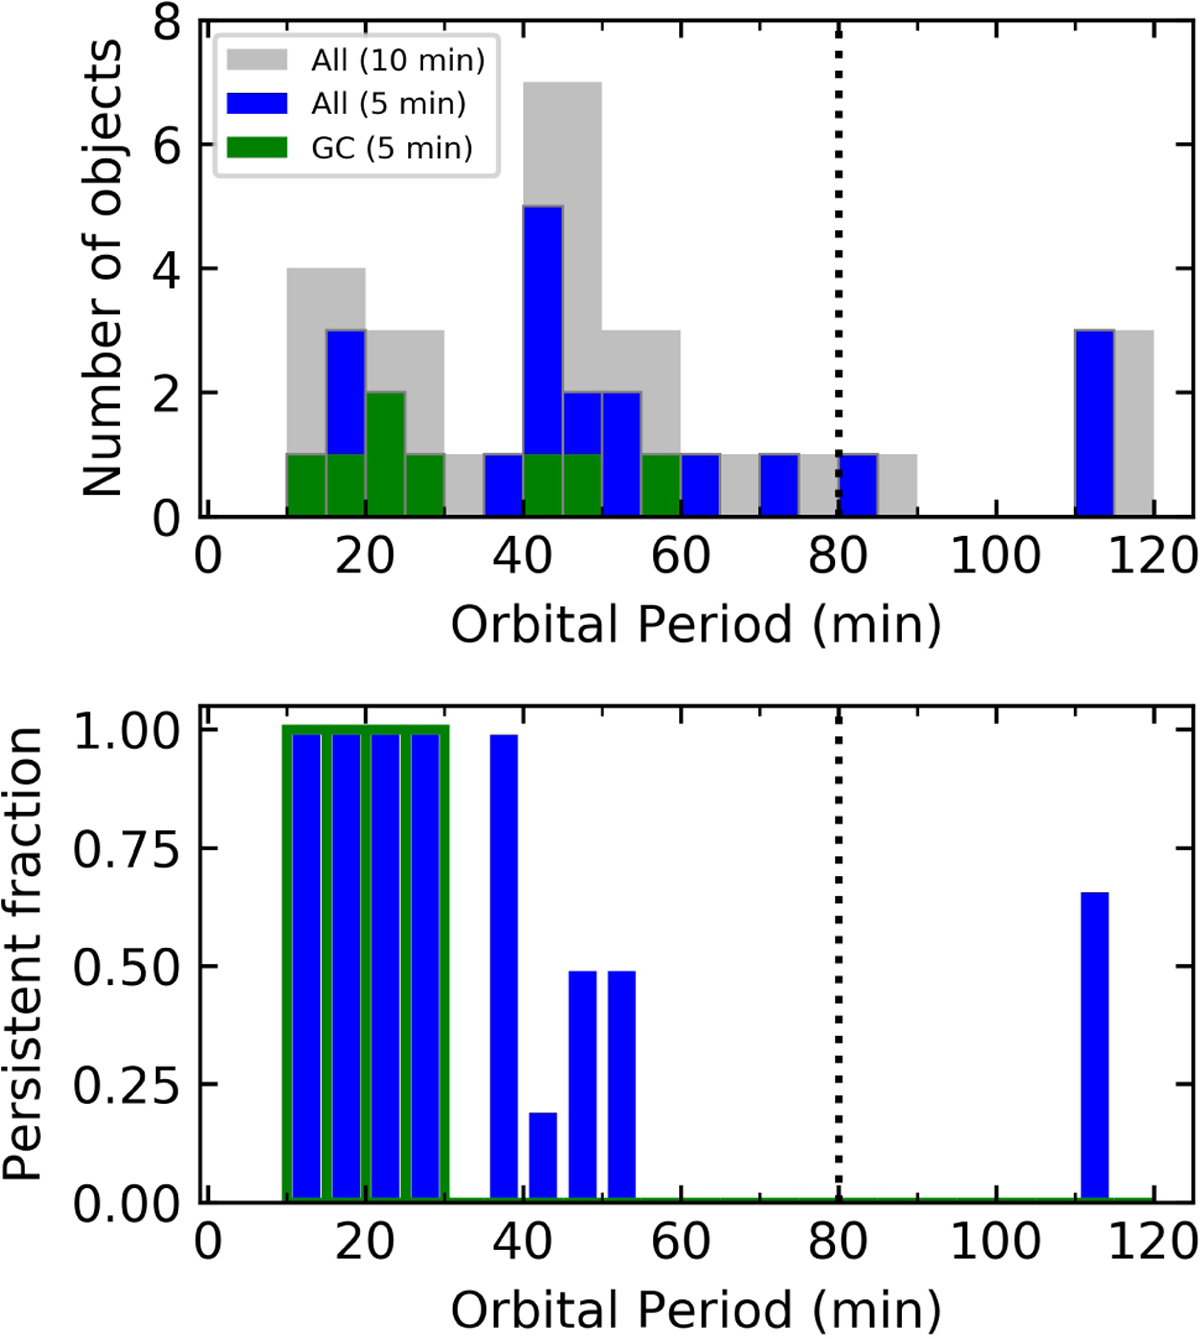
Orbital period distribution. Top panel: Histogram of the orbital period of UCXBs and short-period LMXB systems, plotted in 10 min bins (grey) and 5 min bins [blue for all systems (field + GC) and green for those located in GCs]. The canonical 80 min that defines the bona fide UCXBs limit is shown as a dotted black line. Lower panel: Percentage of systems accreting persistently.
Current usage metrics show cumulative count of Article Views (full-text article views including HTML views, PDF and ePub downloads, according to the available data) and Abstracts Views on Vision4Press platform.
Data correspond to usage on the plateform after 2015. The current usage metrics is available 48-96 hours after online publication and is updated daily on week days.
Initial download of the metrics may take a while.