Fig. 7
Download original image
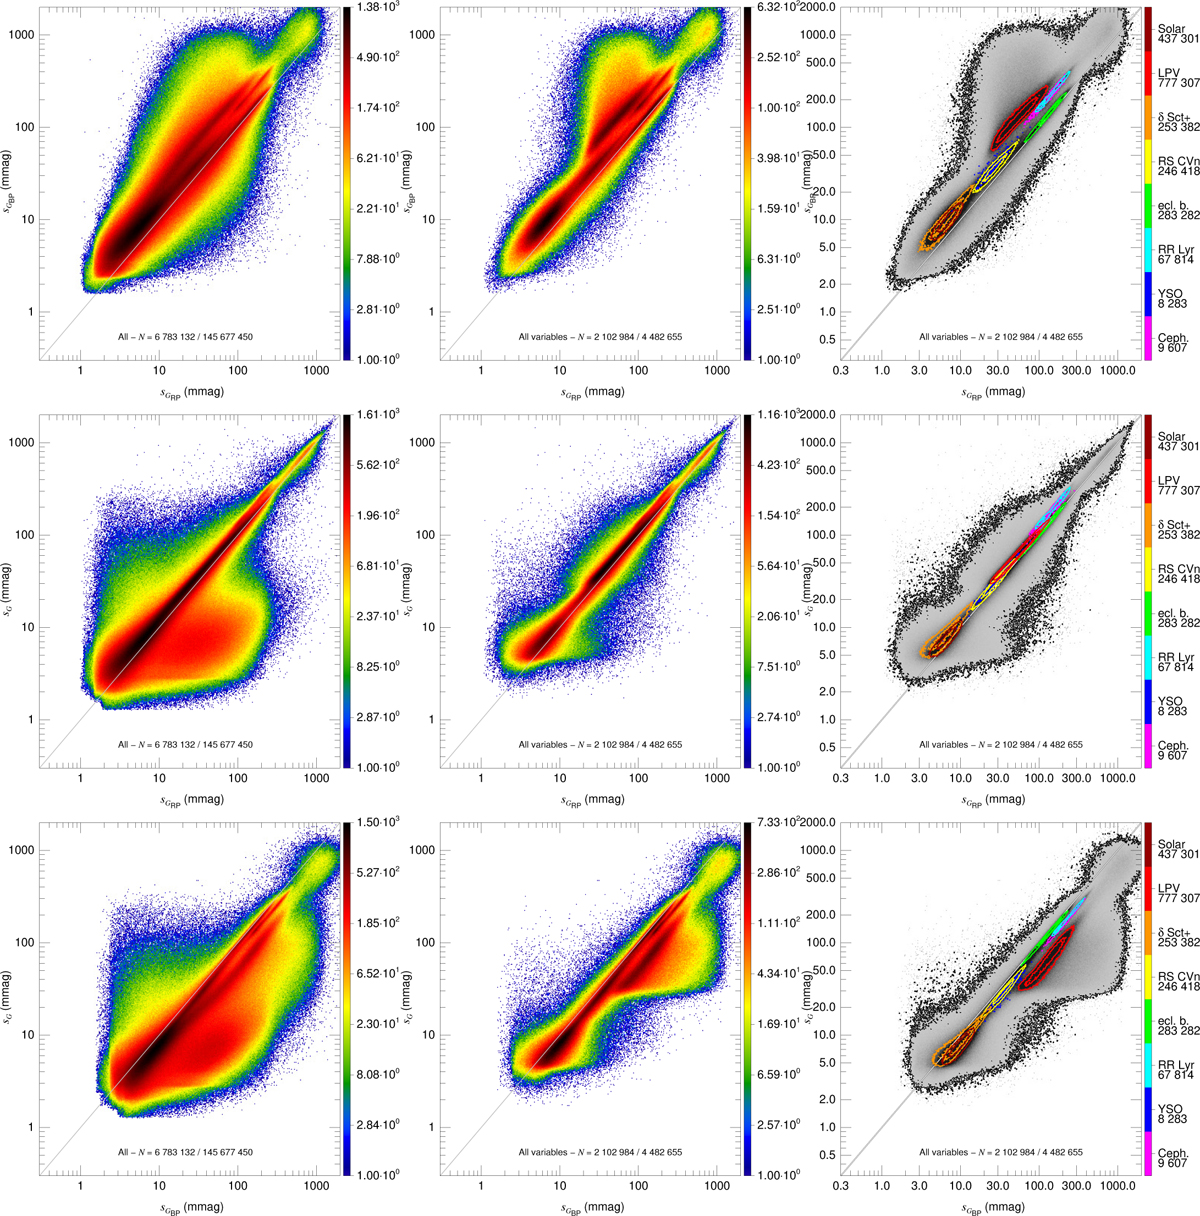
Astrophysical dispersion-dispersion density diagrams for the three color combinations for stars that are classified as VVV here and have dispersion uncertainties ![]() lower than 1 mmag in the three bands. The left column shows the source density in a colored logarithmic scale for the 6 979 556 objects in the sample that satisfy those conditions. The center column is the equivalent for the 2 057 225 objects that, in addition, have variable types in R23. The right column is a version of the center column with the source density in a gray linear scale and with the addition of a black contour at its lowest level (1 object per bin) and two colored contours (at the 40% and 70% of the maximum) for eight of the most common types of variables. See Fig. B.2 for plots of the ratios of the astrophysical dispersion for the different variable types.
lower than 1 mmag in the three bands. The left column shows the source density in a colored logarithmic scale for the 6 979 556 objects in the sample that satisfy those conditions. The center column is the equivalent for the 2 057 225 objects that, in addition, have variable types in R23. The right column is a version of the center column with the source density in a gray linear scale and with the addition of a black contour at its lowest level (1 object per bin) and two colored contours (at the 40% and 70% of the maximum) for eight of the most common types of variables. See Fig. B.2 for plots of the ratios of the astrophysical dispersion for the different variable types.
Current usage metrics show cumulative count of Article Views (full-text article views including HTML views, PDF and ePub downloads, according to the available data) and Abstracts Views on Vision4Press platform.
Data correspond to usage on the plateform after 2015. The current usage metrics is available 48-96 hours after online publication and is updated daily on week days.
Initial download of the metrics may take a while.