Fig. 4
Download original image
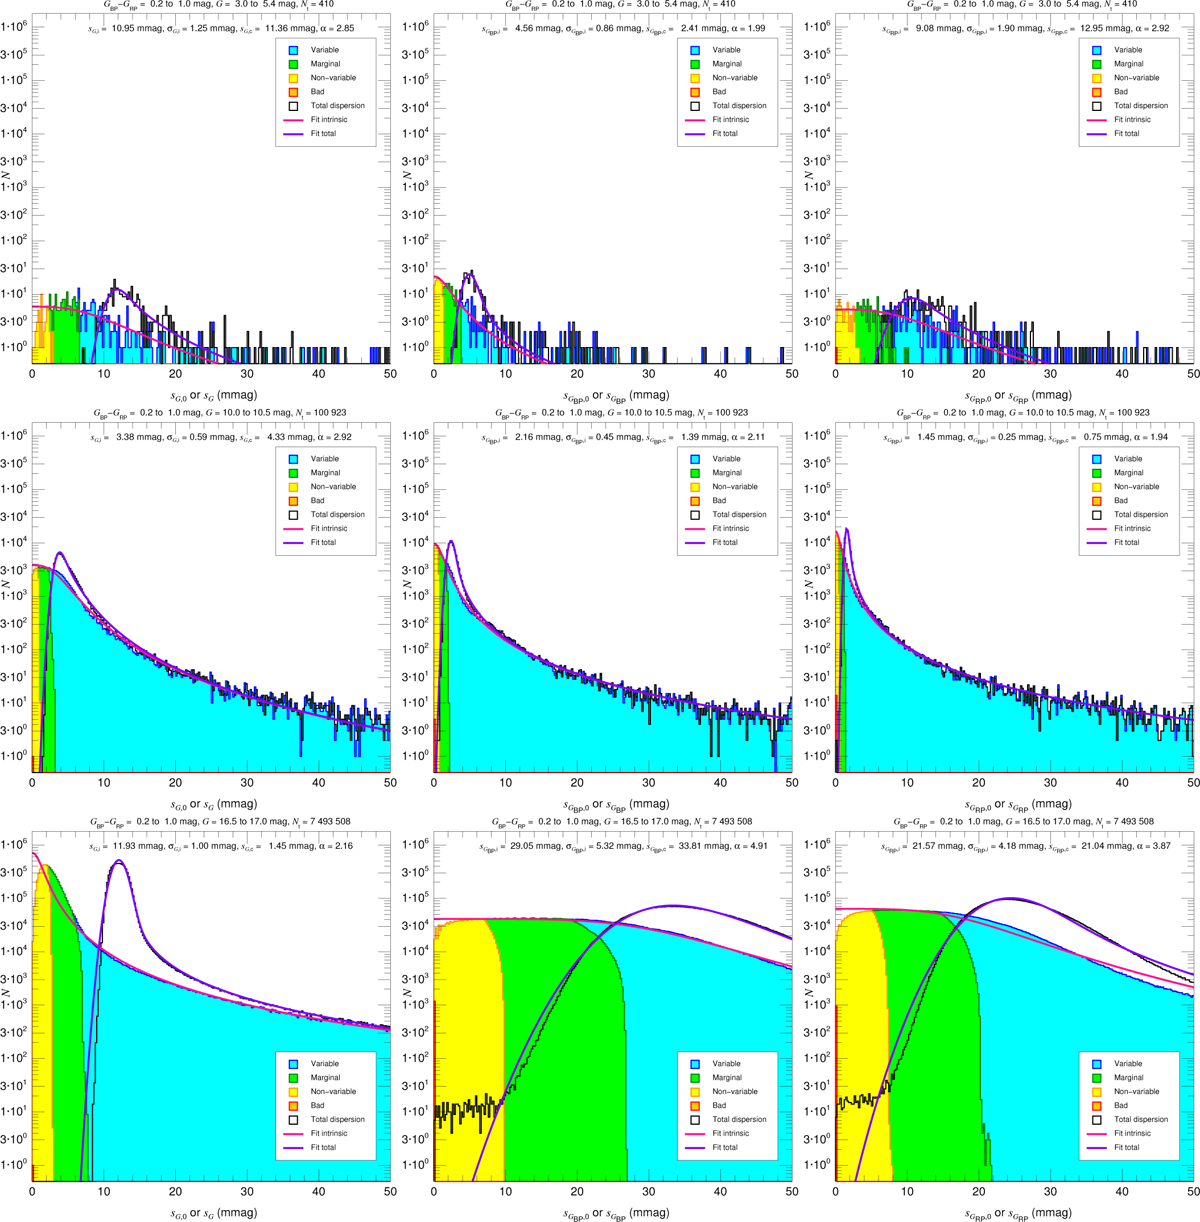
Selected astrophysical dispersion histograms. The three columns show the histograms for G (left), GBP (center) and GRP (right) and the rows show different magnitude ranges: 3.5-5.4 (top), 10.0-10.5 (middle), and 16.5-17.0 (bottom). The GBP – GRP range is always 0.2−1.0 mag. Different colors are used to fill each astrophysical dispersion histogram to show the values of the variability flag for each filter (see text), note that there is one orange bin at most per panel. In addition, an empty histogram shows the corresponding total dispersion histogram. Finally, two lines of different color indicate the fitted function in the form of the astrophysical (pink) and total (purple) dispersions, respectively. The text at the top of each panel gives the results of the fits.
Current usage metrics show cumulative count of Article Views (full-text article views including HTML views, PDF and ePub downloads, according to the available data) and Abstracts Views on Vision4Press platform.
Data correspond to usage on the plateform after 2015. The current usage metrics is available 48-96 hours after online publication and is updated daily on week days.
Initial download of the metrics may take a while.