Fig. 3
Download original image
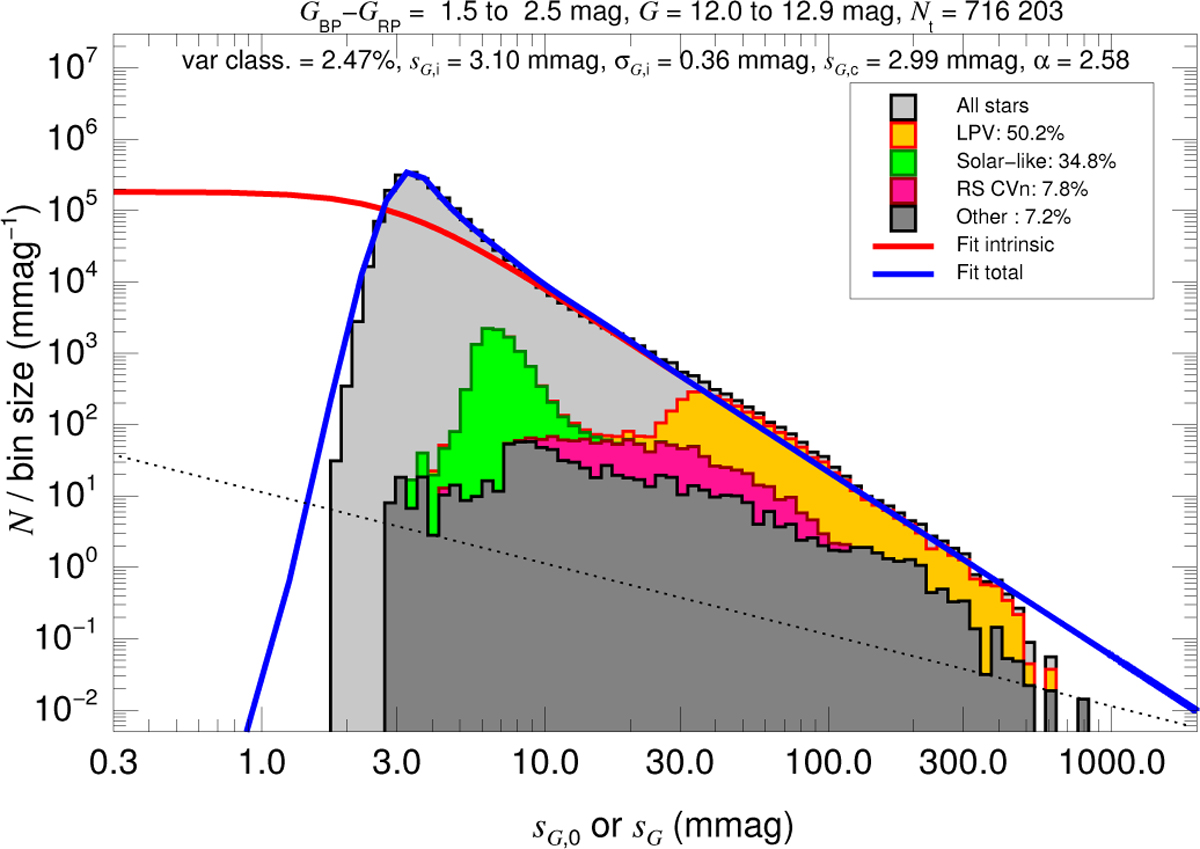
Example of a total dispersion histogram used to calculate the instrumental dispersion as a function of magnitude and color (see Fig. B.1 for the whole set). The histogram has a uniform bin size in logarithmic units (see the text for the bins used for fitting) and both the horizontal and vertical scales are logarithmic. The dotted diagonal line indicates the location of one star per bin to estimate Poisson fluctuations. The light grey histogram shows the total sample, the color histograms the three most common types of variable stars from the R23 data for that magnitude and color ranges, and the dark grey histogram the rest of the R23 variables. The four histograms built from R23 data are cumulative, so the top colored line represents all of the variables. The blue line shows the fit for the total dispersion and the red line the corresponding distribution for the astrophysical (intrinsic) dispersion. The text at the top gives the results of the fits and the percentage of stars with a variability classification from R23.
Current usage metrics show cumulative count of Article Views (full-text article views including HTML views, PDF and ePub downloads, according to the available data) and Abstracts Views on Vision4Press platform.
Data correspond to usage on the plateform after 2015. The current usage metrics is available 48-96 hours after online publication and is updated daily on week days.
Initial download of the metrics may take a while.