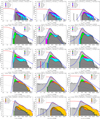
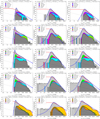
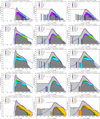
Fig. B.1
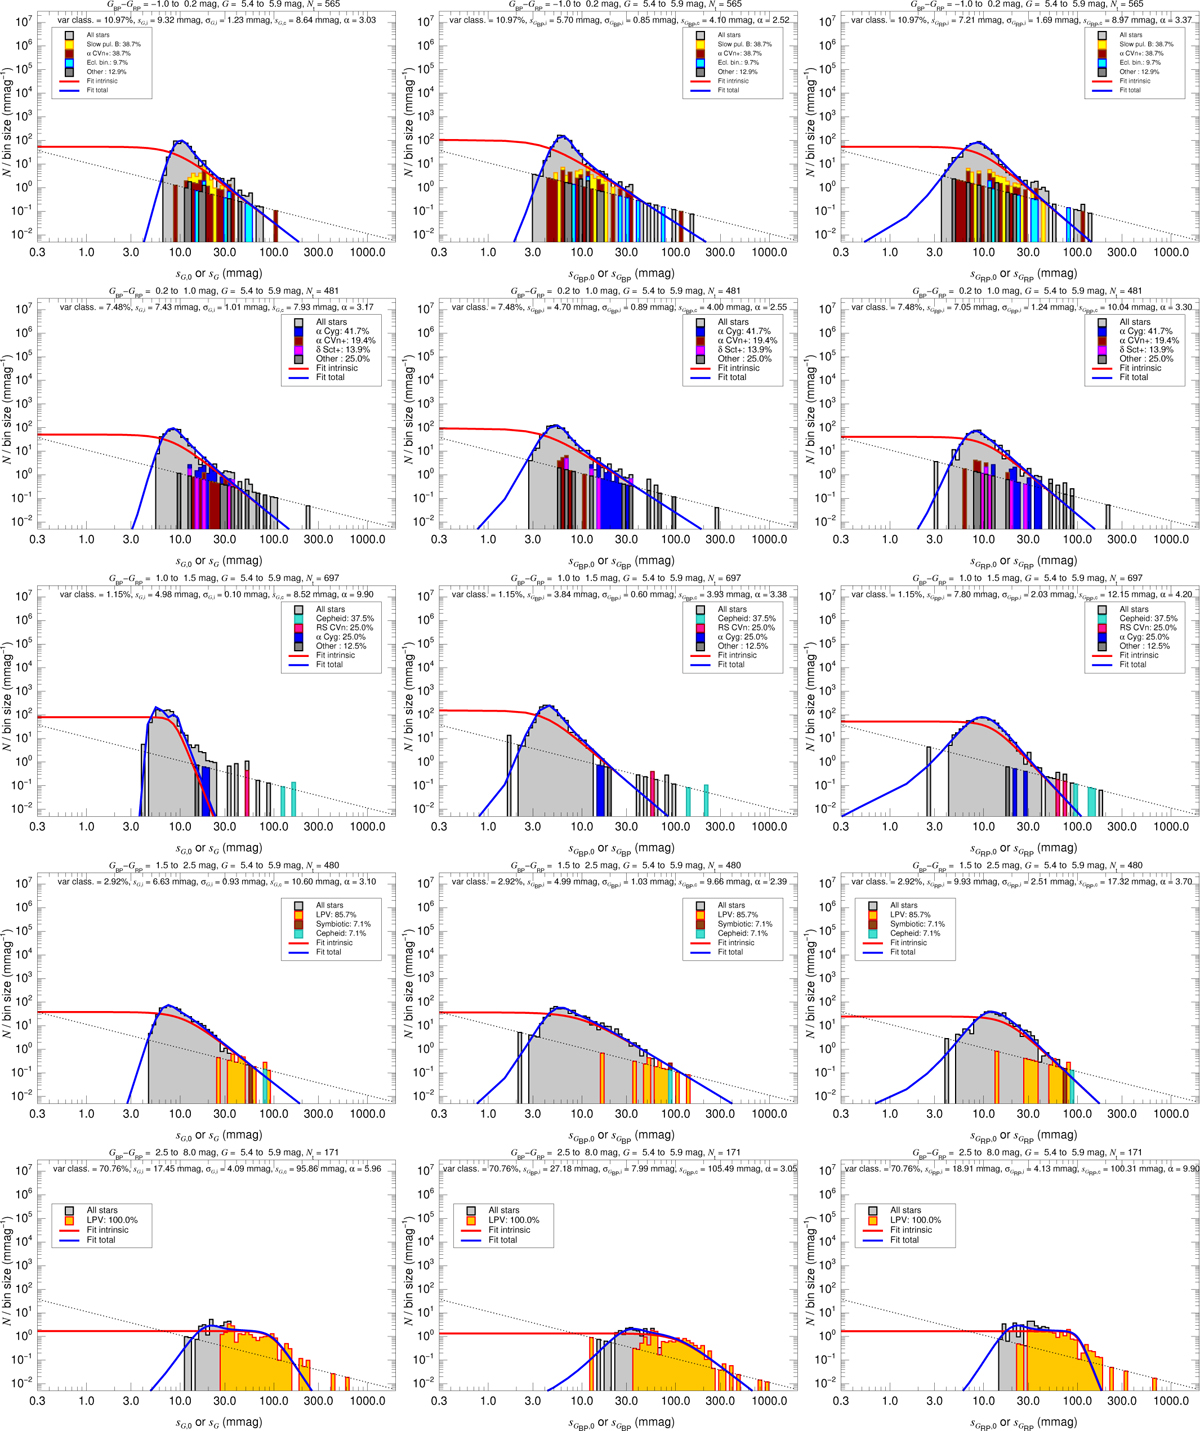
Download original image
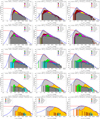
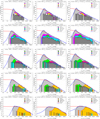
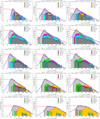
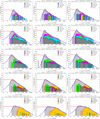
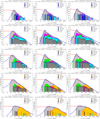
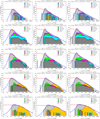
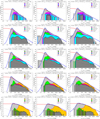
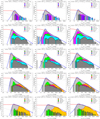
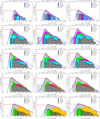
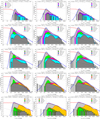
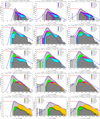
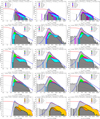
(continued from previous page). The grey histogram shows the total sample and each panel also shows the histograms for the three most common types of variable stars from the R23 data for that magnitude and color ranges (each in a different color that is maintained the same throughout the figure for a given variable type) as well as a fourth histogram with the rest of the R23 variables. The four histograms built from R23 data are cumulative, so the top colored line represents all of the variables. The blue line shows the fit for the total dispersion and the red line the corresponding distribution for the astrophysical (intrinsic) dispersion. The text at the top of each panel gives the results of the fits and the percentage of stars with a variability classification from R23.
Current usage metrics show cumulative count of Article Views (full-text article views including HTML views, PDF and ePub downloads, according to the available data) and Abstracts Views on Vision4Press platform.
Data correspond to usage on the plateform after 2015. The current usage metrics is available 48-96 hours after online publication and is updated daily on week days.
Initial download of the metrics may take a while.