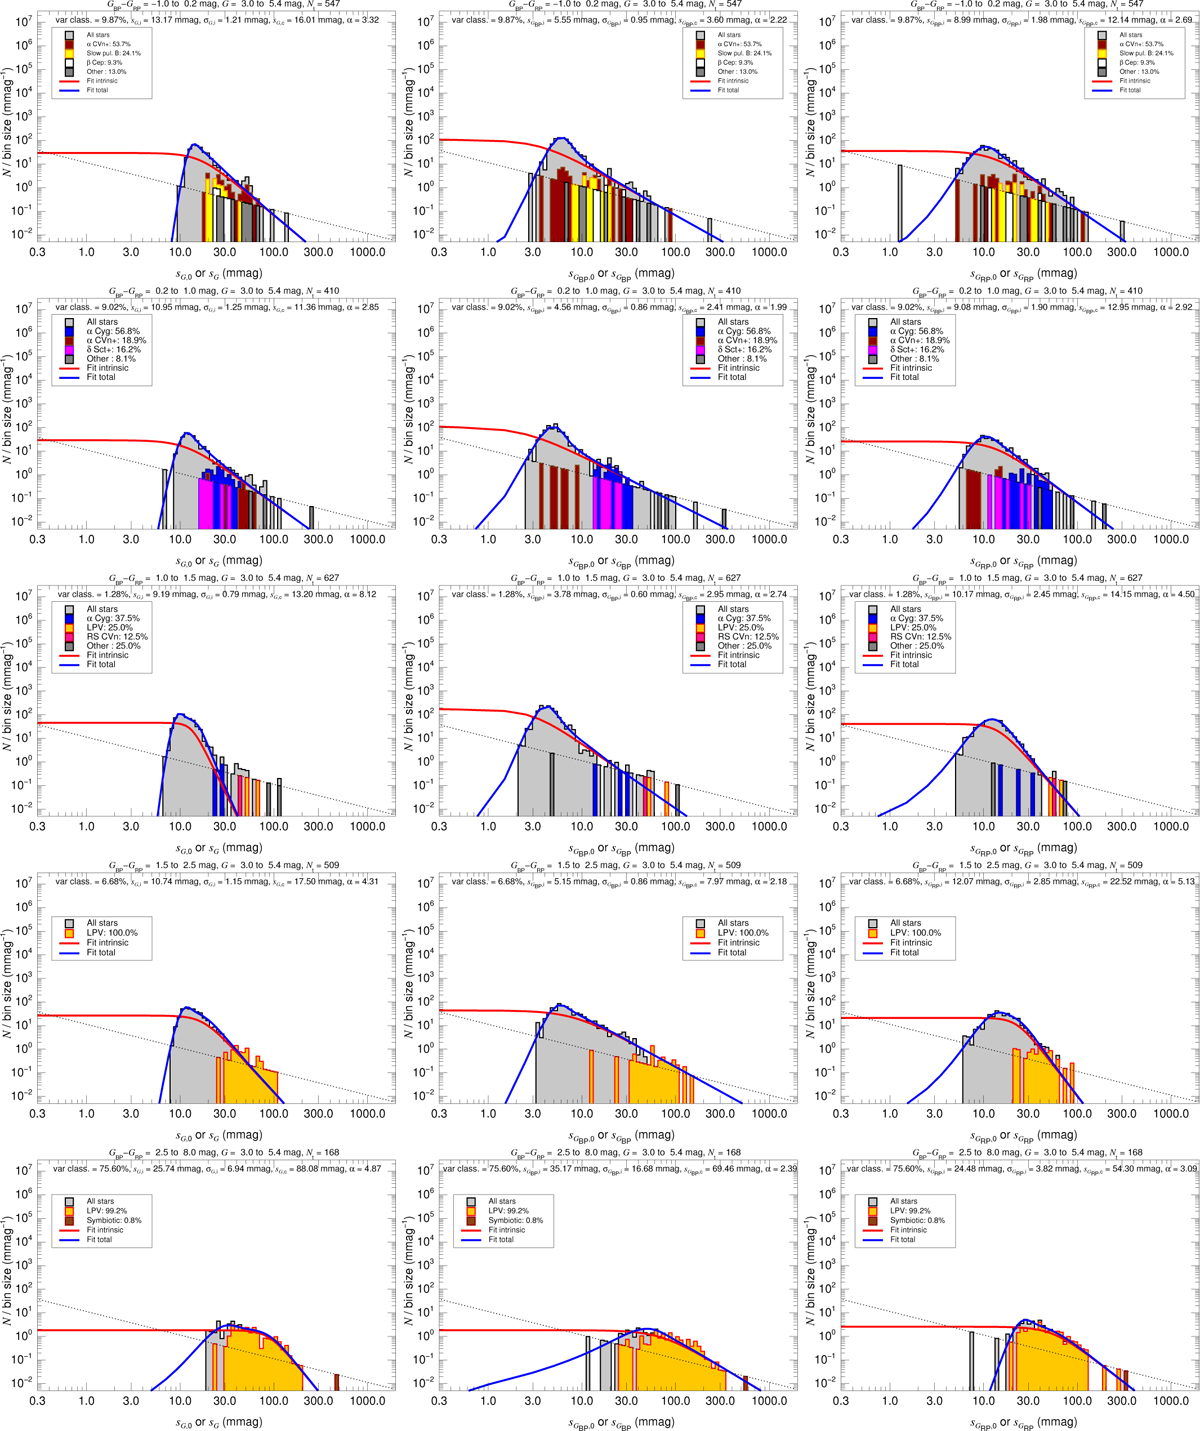
Fig. B.1
Download original image
Total dispersion histograms used to calculate the instrumental dispersion as a function of magnitude and color. Each page shows the 15 plots for a given G magnitude range, starting with 3.0–5.3 mag. The three columns show the histograms for G (left), GBP (center) and GRP (right). The five rows show the GBP – GRP ranges, from top to bottom: −1.0–0.2, 0.2–1.0, 1.0–1.5, 1.5–2.5, and 2.5–8.0 (in mag). The histograms have a uniform bin size in logarithmic units (see the text for the bins used for fitting) and both the horizontal and vertical scales are logarithmic and the same in all plots to allow for better comparisons. The dotted diagonal line indicates the location of one star per bin to estimate Poisson fluctuations.
Current usage metrics show cumulative count of Article Views (full-text article views including HTML views, PDF and ePub downloads, according to the available data) and Abstracts Views on Vision4Press platform.
Data correspond to usage on the plateform after 2015. The current usage metrics is available 48-96 hours after online publication and is updated daily on week days.
Initial download of the metrics may take a while.