Open Access
Fig. 18
Download original image
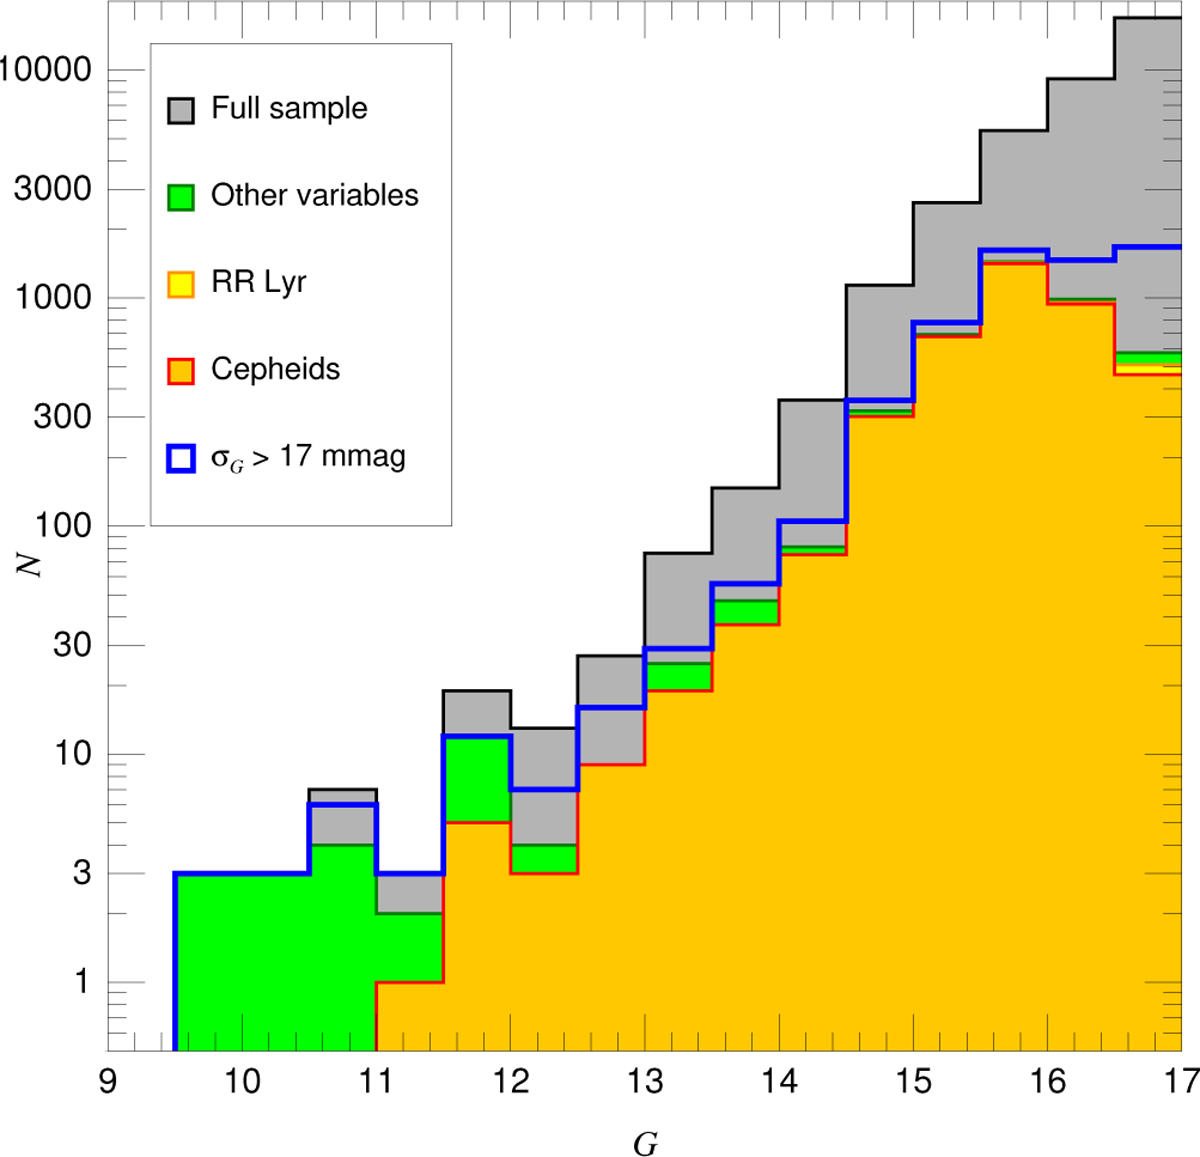
G histograms for the stars in the LMC instability strip. The filled polygons are cumulative histograms for the full sample, non-RR Lyr non-Cepheid variables from R23, RR Lyr from R23, and Cepheids from R23. The blue unfilled line is an independent histogram containing all stars with sG > 17 mmag.
Current usage metrics show cumulative count of Article Views (full-text article views including HTML views, PDF and ePub downloads, according to the available data) and Abstracts Views on Vision4Press platform.
Data correspond to usage on the plateform after 2015. The current usage metrics is available 48-96 hours after online publication and is updated daily on week days.
Initial download of the metrics may take a while.