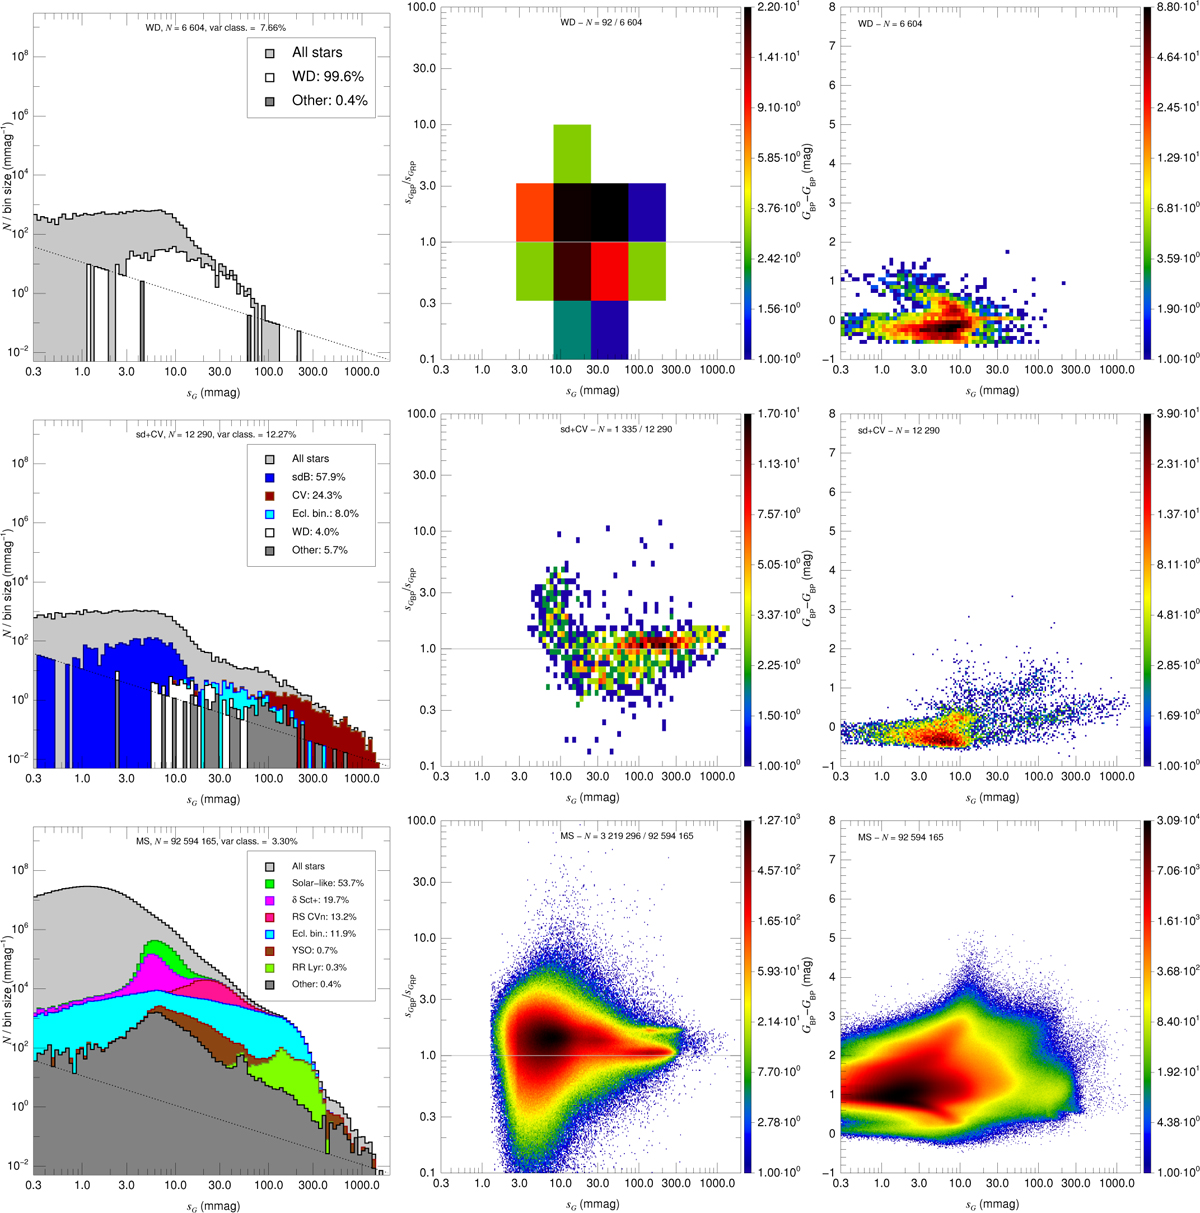
Fig. 16
Download original image
Results for the first three of the six MW CAMD regions. Left column: astrophysical G dispersion histograms. The histograms have a uniform bin size but both the horizontal and vertical scales are logarithmic and the same for all plots to allow for better comparisons. The grey histogram shows the total sample and each panel also shows the histograms for the most common types of variable stars from the R23 data for that CAMD region (each in a different color that is maintained the same throughout this figure and the next for a given variable type) as well as another histogram with the rest of the R23 variables. The histograms built from R23 data are cumulative, so the top colored line represents all of the variables. The text at the top of each panel gives the number of stars and the percentage of stars with a variability classification from R23. The dotted diagonal line indicates the location of one star per bin to estimate Poisson fluctuations. Center column: astrophysical G dispersion-astrophysical GBP to GRP dispersion ratio density diagrams selecting stars that have uncertainties in the y axis lower than 50%. The number of selected stars and the total number are given at the top of each panel. The bin size is adjusted for each region depending on the number of sources. Right column: astrophysical G dispersion–GBP – GRP density diagrams. Note that the left and right columns include all stars in the regions while the center column only has a selection.
Current usage metrics show cumulative count of Article Views (full-text article views including HTML views, PDF and ePub downloads, according to the available data) and Abstracts Views on Vision4Press platform.
Data correspond to usage on the plateform after 2015. The current usage metrics is available 48-96 hours after online publication and is updated daily on week days.
Initial download of the metrics may take a while.