Fig. 11
Download original image
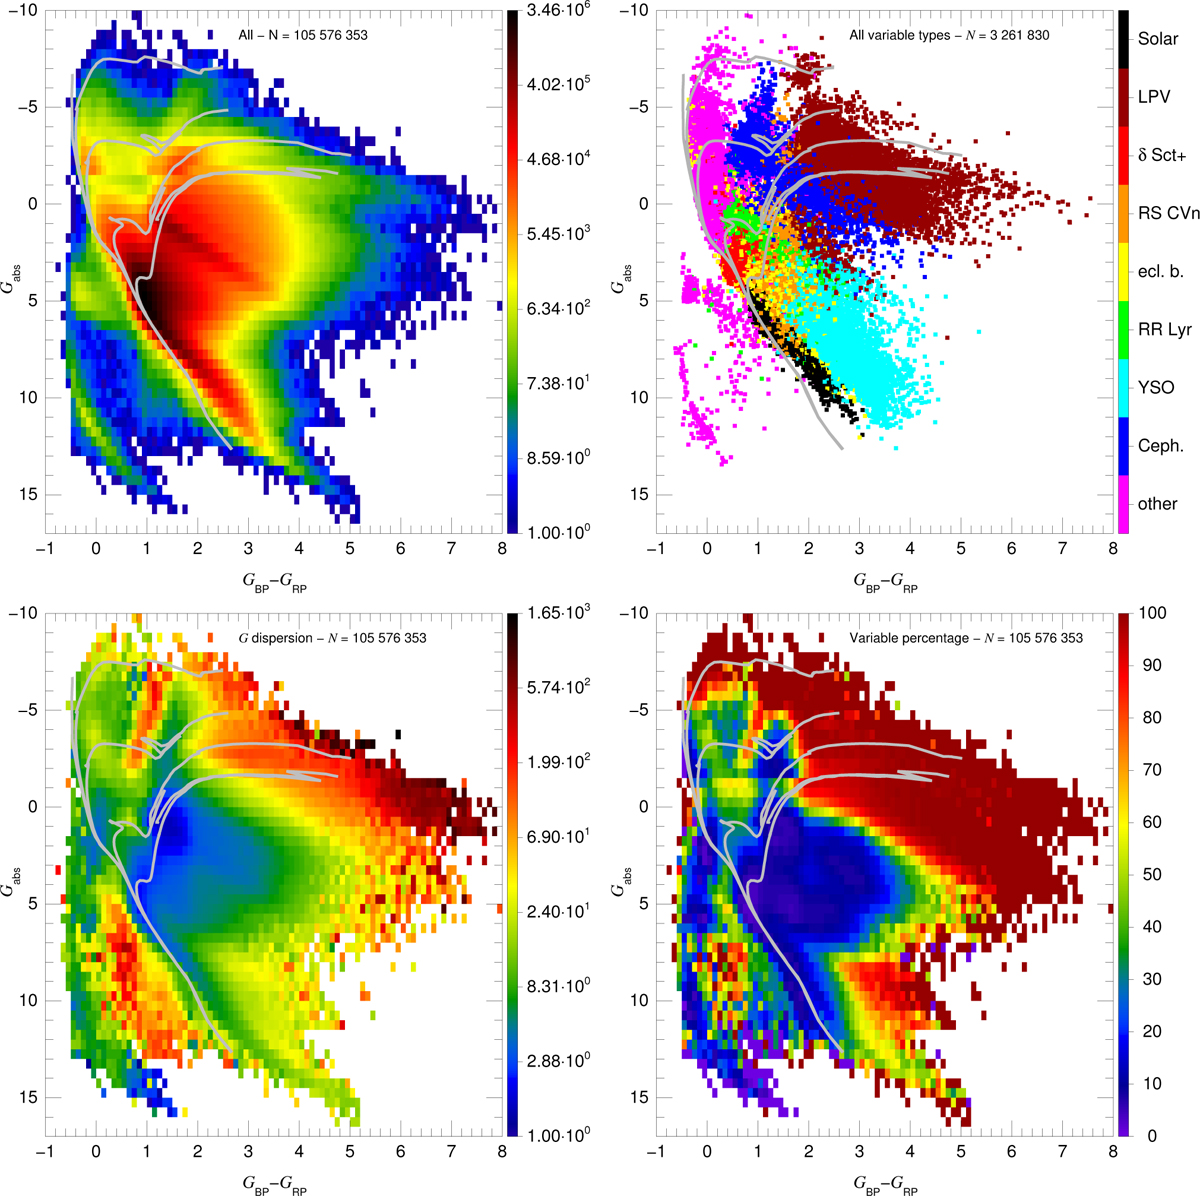
Color-absolute magnitude style diagrams for the sample in this paper with accurate distances. Top left: source density. Top right: variable types from the R23 subsample with classifications. Bottom left: average G astrophysical dispersion. Bottom right: percentage of objects with VVV variability flag. Isochrones for 1 Ma, 10 Ma, 100 Ma, 1 Ga, and 10 Ga (in all cases for solar metallicity) are plotted in grey, with the isochrones being a combination of Geneva (Lejeune & Schaerer 2001) for high-mass stars and Padova (Girardi et al. 2000; Salasnich et al. 2000) for low-mass stars (see Maíz Apellániz 2013). The two black dotted vertical lines in the first panel show the location of the color limits for the calculation of the instrumental dispersion. The discontinuity seen around Gabs = −1.5 mag is caused by the inclusion of the LMC (and, to a lesser degree, the SMC at difference of half a magnitude) stars, which dominate the Gaia luminous star population if one does not correct for extinction (compare with Fig. 14). In the top right panel the number of plotted sources per variable type is capped at 10 000 to allow all types to be seen better.
Current usage metrics show cumulative count of Article Views (full-text article views including HTML views, PDF and ePub downloads, according to the available data) and Abstracts Views on Vision4Press platform.
Data correspond to usage on the plateform after 2015. The current usage metrics is available 48-96 hours after online publication and is updated daily on week days.
Initial download of the metrics may take a while.