Fig. 10
Download original image
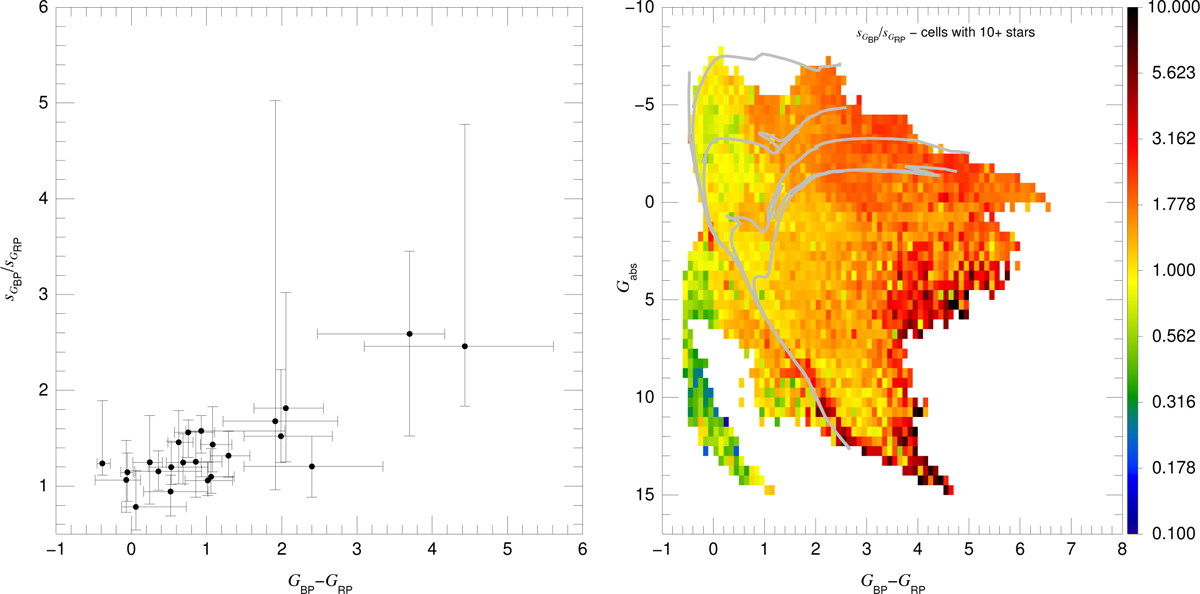
Behavior of ![]() as a function of magnitude and color. Left:
as a function of magnitude and color. Left: ![]() as a function of GBP – GRP from the data in Table 2. The plotted values are the median and the one-sigma equivalents derived from the distribution of each sample, which is done to reflect some of the significant asymmetries in them. Compare this plot to the right panel in Fig. 7 of Mowlavi et al. (2021). Right: average
as a function of GBP – GRP from the data in Table 2. The plotted values are the median and the one-sigma equivalents derived from the distribution of each sample, which is done to reflect some of the significant asymmetries in them. Compare this plot to the right panel in Fig. 7 of Mowlavi et al. (2021). Right: average ![]() across the Gaia CAMD for color-magnitude cells with 10 or more targets.
across the Gaia CAMD for color-magnitude cells with 10 or more targets.
Current usage metrics show cumulative count of Article Views (full-text article views including HTML views, PDF and ePub downloads, according to the available data) and Abstracts Views on Vision4Press platform.
Data correspond to usage on the plateform after 2015. The current usage metrics is available 48-96 hours after online publication and is updated daily on week days.
Initial download of the metrics may take a while.