Fig. 9
Download original image
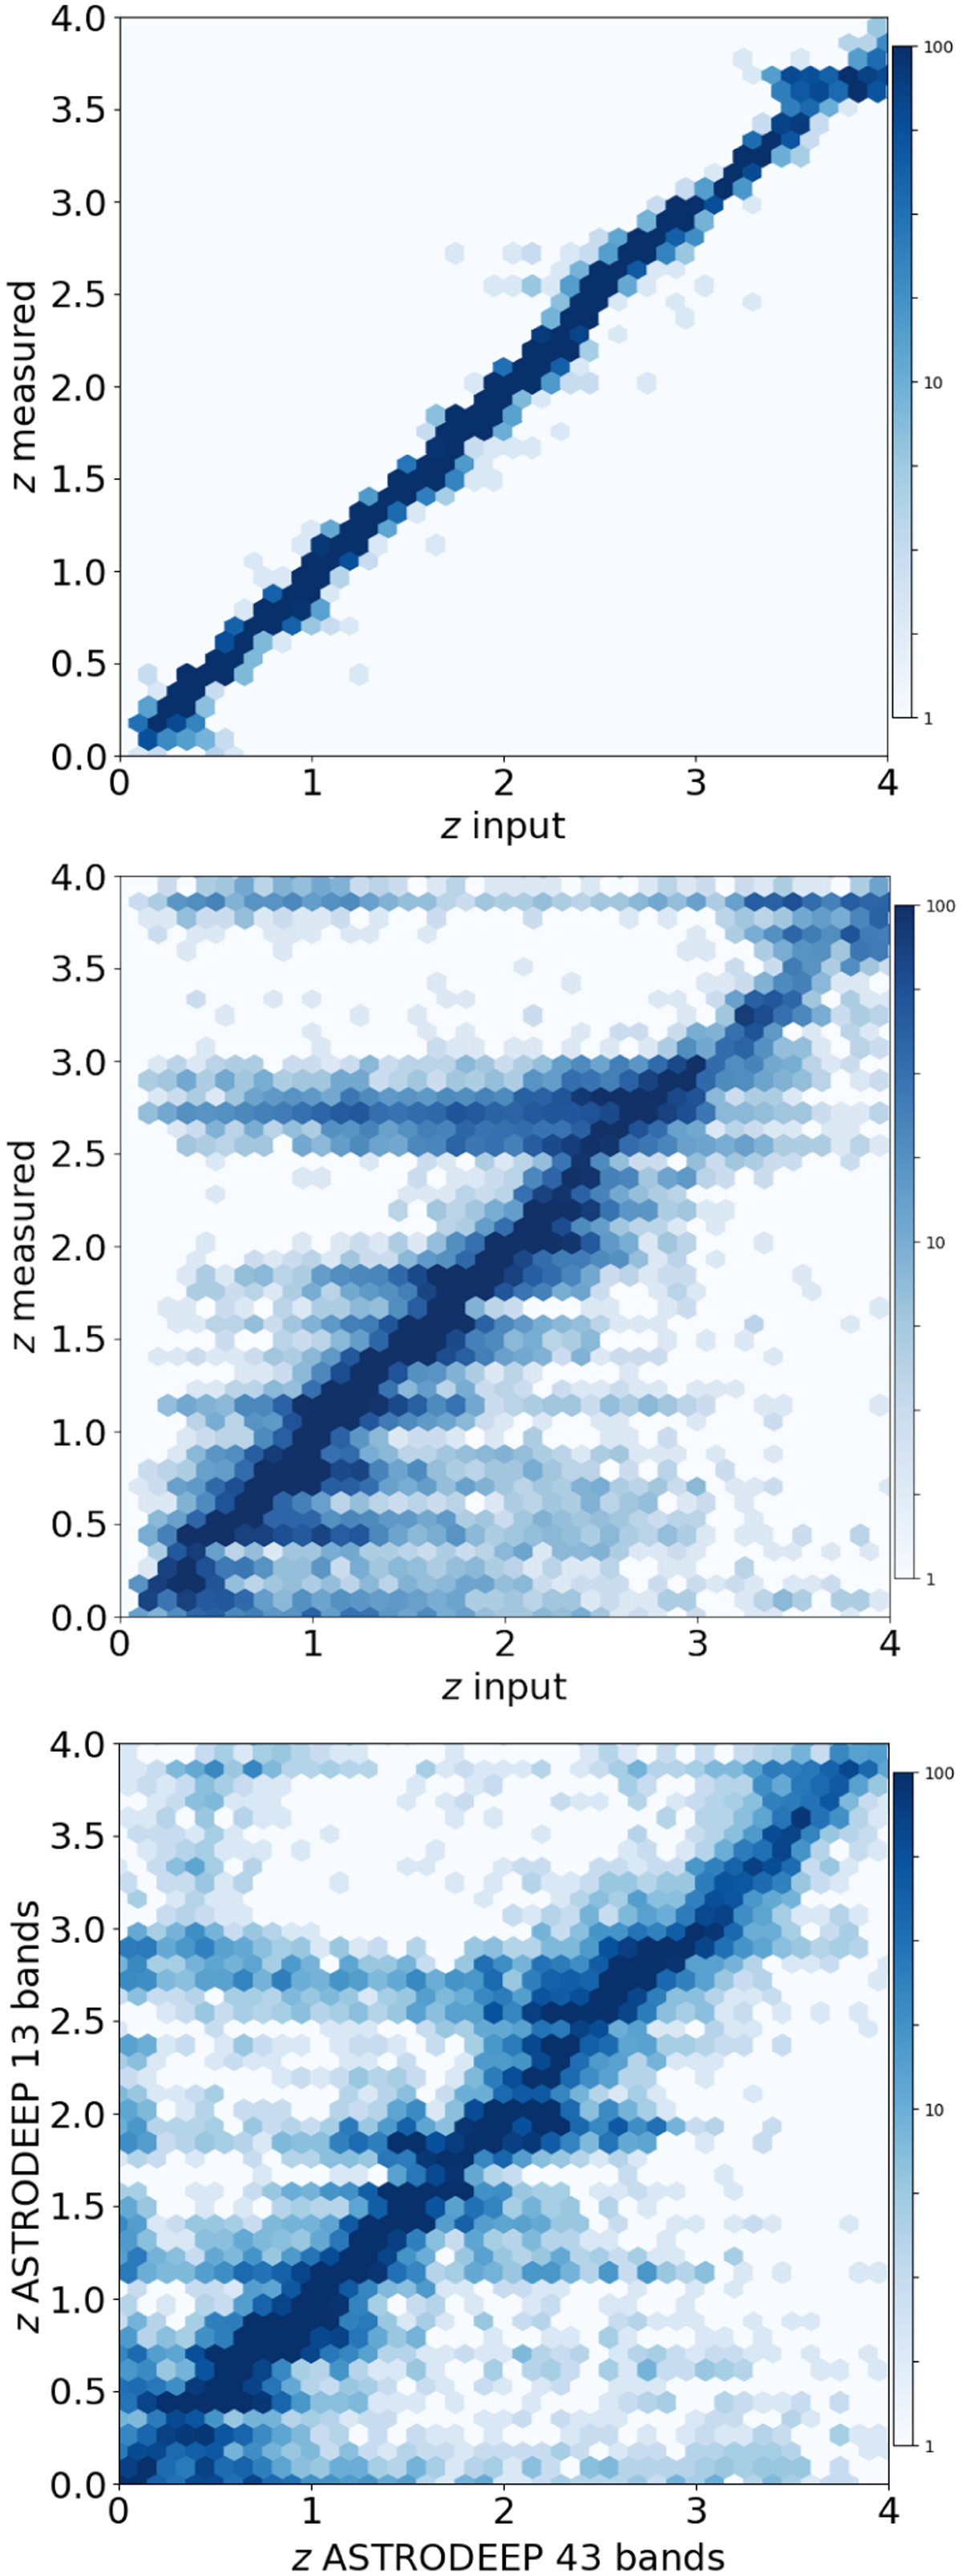
Results of the SED-fitting photometric redshifts estimate using (from top to bottom): (i) ZPHOT and the true fluxes of the input catalog; (ii) ZPHOT and fluxes measured on the H band simulated image; (iii) ZPHOT on GOODS-South ASTRODEEP data. The plot shows the estimated redshifts versus the true redshifts from the input catalog (top and central panel); the redshifts estimated with the 13 bands used in the simulations versus the ones in the ASTRODEEP 43 bands catalog (Merlin et al. 2021, bottom panel).
Current usage metrics show cumulative count of Article Views (full-text article views including HTML views, PDF and ePub downloads, according to the available data) and Abstracts Views on Vision4Press platform.
Data correspond to usage on the plateform after 2015. The current usage metrics is available 48-96 hours after online publication and is updated daily on week days.
Initial download of the metrics may take a while.