Fig. 6
Download original image
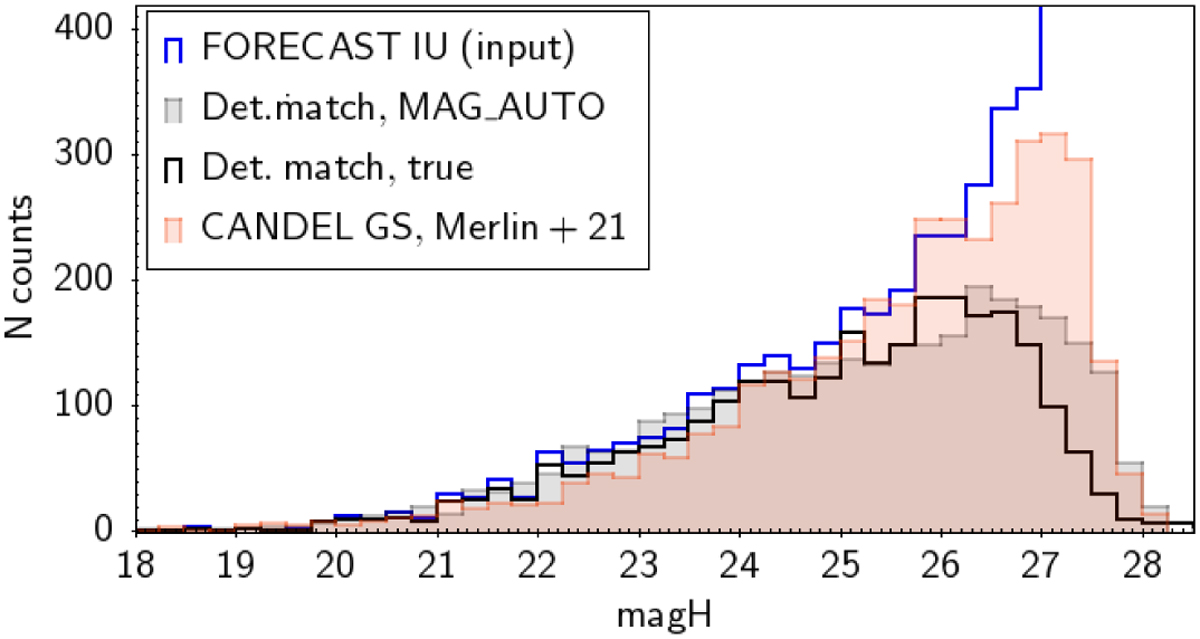
Number counts in the H detection band, relatively to an area of ~16 sq. arcmin in order to be comparable with a region of the same area and with homogeneous depth from CANDELS GOODS-South DEEP (red shaded histogram). Blue line: IU counts; gray shadow: all detections, using SEXTRACTOR MAG_AUTO as total flux estimate; black solid line: IU (true) flux of the detected sources with an IU match.
Current usage metrics show cumulative count of Article Views (full-text article views including HTML views, PDF and ePub downloads, according to the available data) and Abstracts Views on Vision4Press platform.
Data correspond to usage on the plateform after 2015. The current usage metrics is available 48-96 hours after online publication and is updated daily on week days.
Initial download of the metrics may take a while.