Fig. 5
Download original image
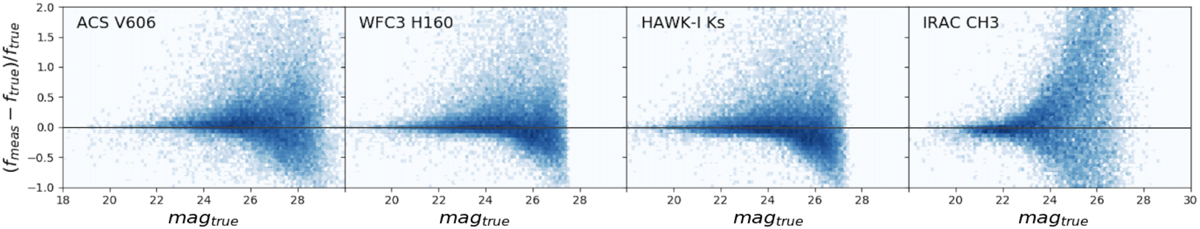
Comparison between input and measured fluxes of the detected galaxies matched with the IU, in the V606, H160, Ks, and IRAC CH3 simulated band. The panels show the relative errors in flux measurement, (ƒmeas − ƒtrue)/ƒtrue, as a function of the input true magnitude; so values above zero mean over-estimation of fluxes with respect to the true values, while values below zero mean under-estimation. The color coding gives the density of sources in every point of the plots.
Current usage metrics show cumulative count of Article Views (full-text article views including HTML views, PDF and ePub downloads, according to the available data) and Abstracts Views on Vision4Press platform.
Data correspond to usage on the plateform after 2015. The current usage metrics is available 48-96 hours after online publication and is updated daily on week days.
Initial download of the metrics may take a while.