Fig. A.1
Download original image
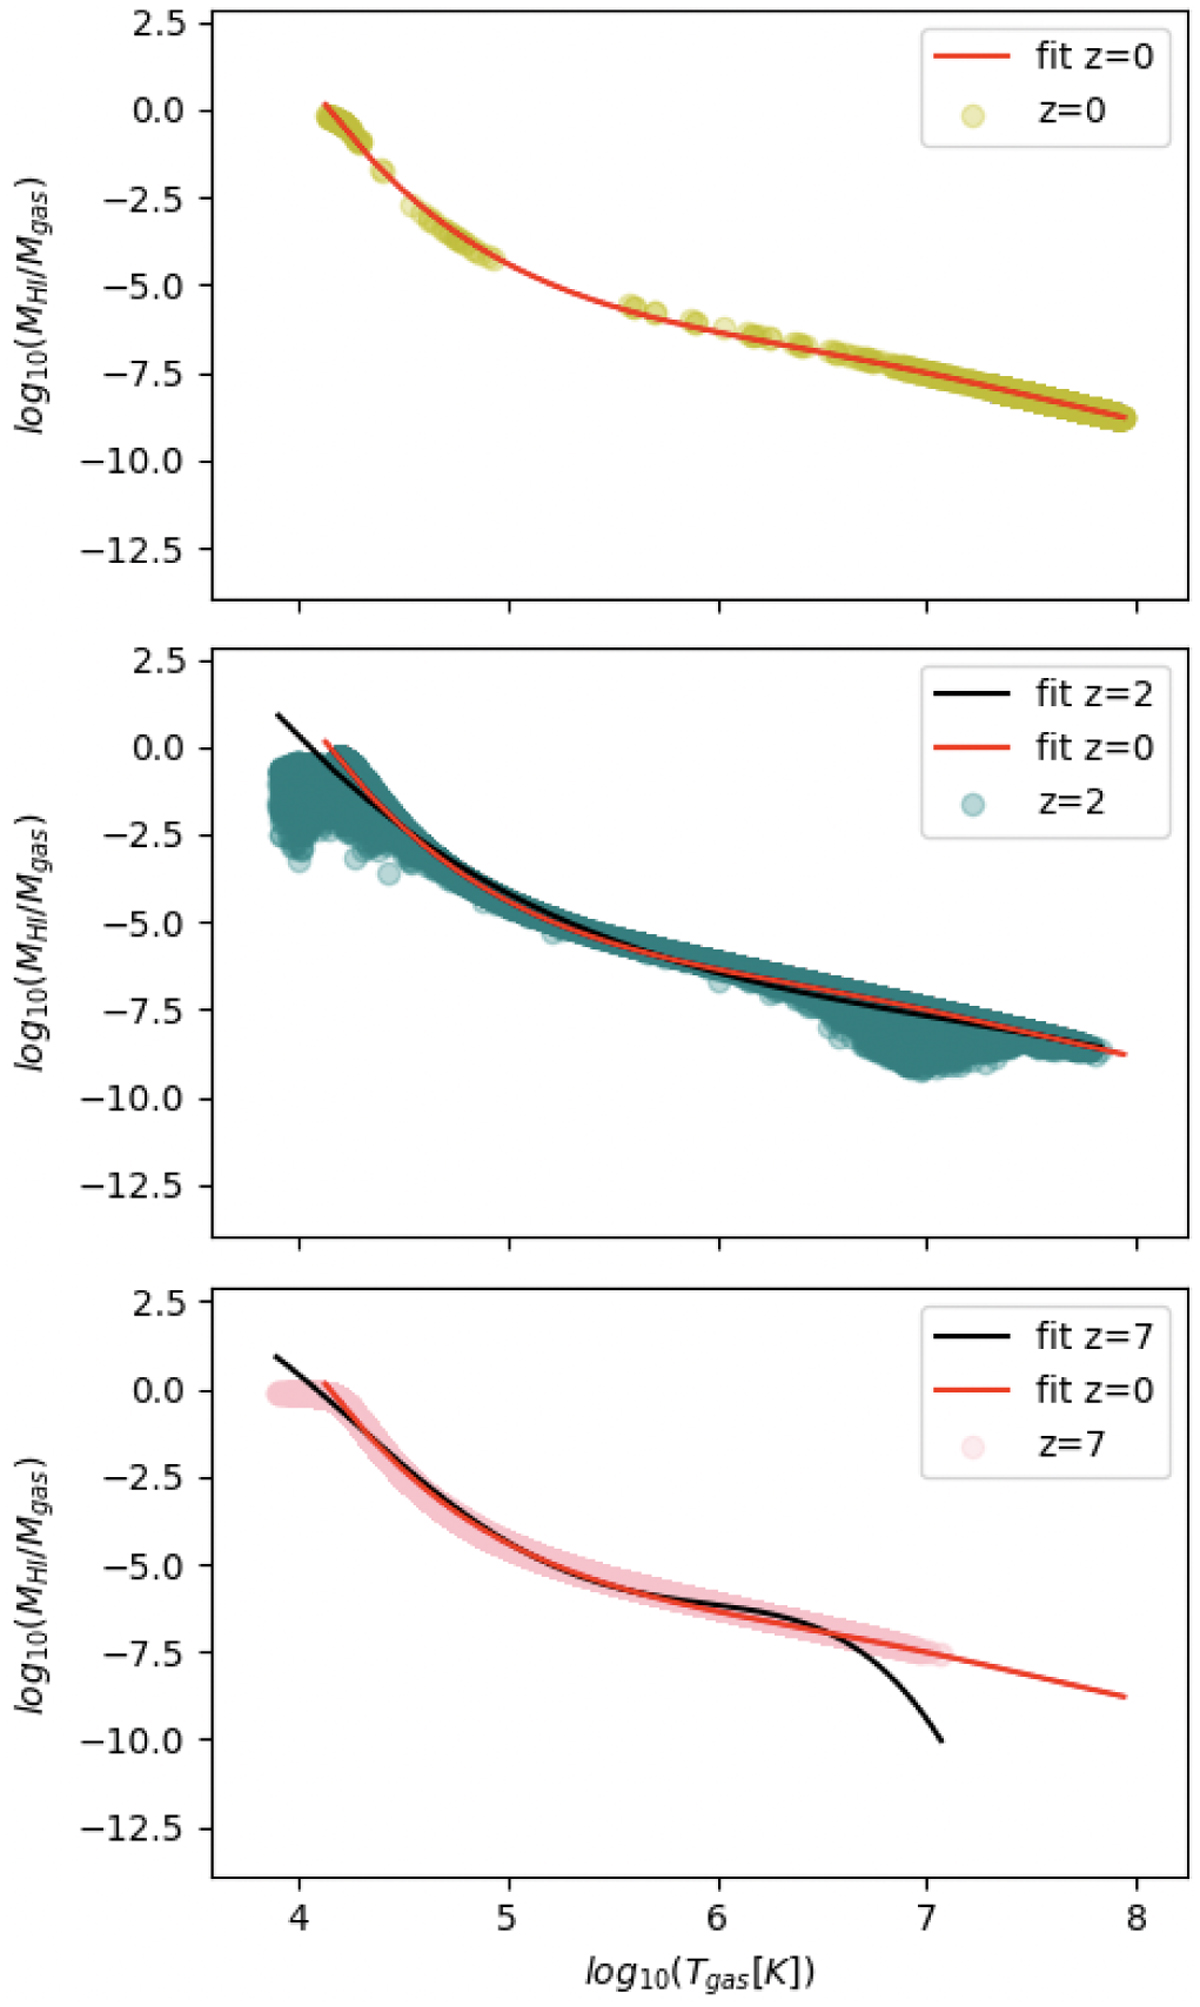
Scaling relation between neutral hydrogen-to-gas mass ratio MHI/Mɡ and the temperature of the gas Tɡ in the “full snapshots” of the ILLUSTRISTNG100 simulation, where the neutral hydrogen fraction is available (z = 0, 2, 7). The red curve is the best fourth-grade polynomial fit at z = 0; black curves are best fits for the data points (dots) at the redshift of each panel.
Current usage metrics show cumulative count of Article Views (full-text article views including HTML views, PDF and ePub downloads, according to the available data) and Abstracts Views on Vision4Press platform.
Data correspond to usage on the plateform after 2015. The current usage metrics is available 48-96 hours after online publication and is updated daily on week days.
Initial download of the metrics may take a while.