Fig. 4
Download original image
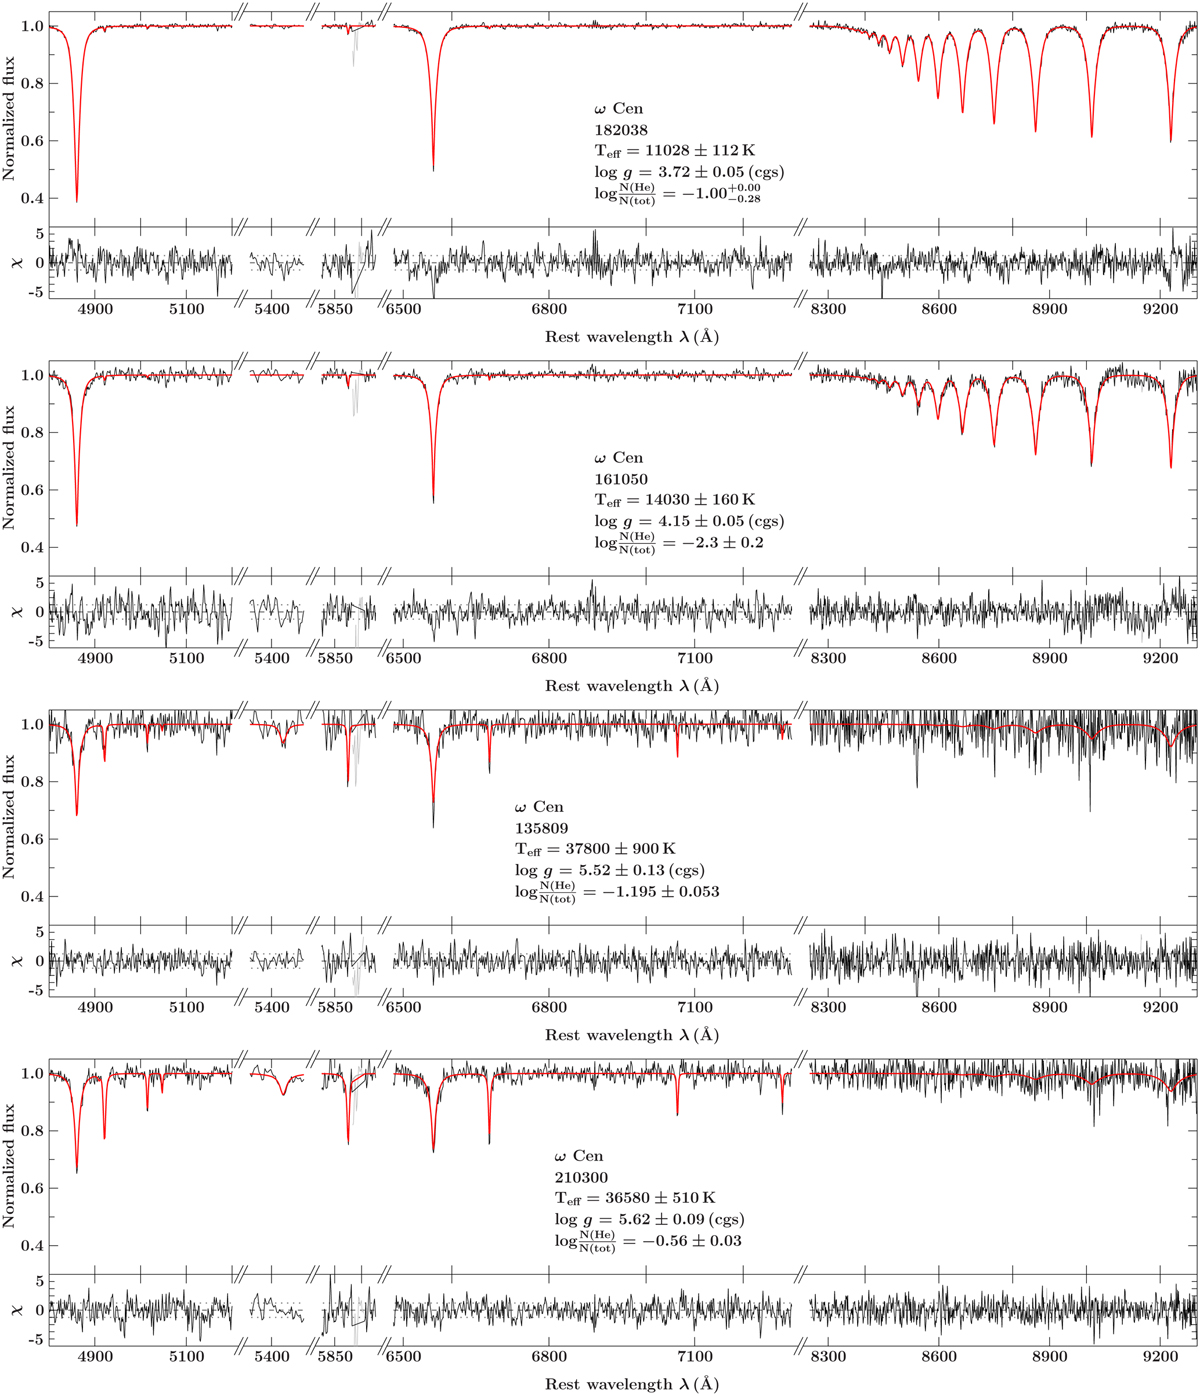
Examples of spectroscopic fits for stars in ω Cen. Best fit (red) to the normalized spectrum (black) of, from top to bottom, an A-BHB, B-BHB, EHB, and blue-hook star. The residuals are shown below each fit. Only the regions with spectral lines of hydrogen and helium are plotted. The cluster name, star identification number, and resulting spectral parameters are indicated for each fit.
Current usage metrics show cumulative count of Article Views (full-text article views including HTML views, PDF and ePub downloads, according to the available data) and Abstracts Views on Vision4Press platform.
Data correspond to usage on the plateform after 2015. The current usage metrics is available 48-96 hours after online publication and is updated daily on week days.
Initial download of the metrics may take a while.