Fig. 11
Download original image
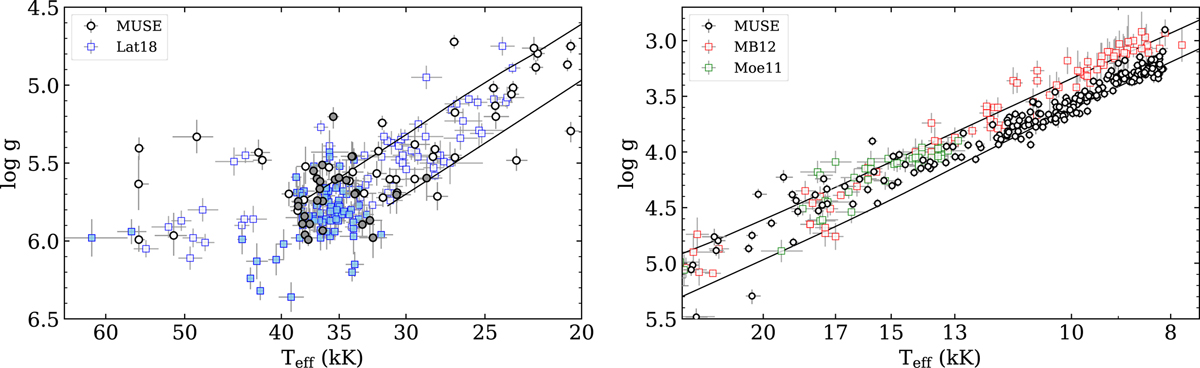
Kiel diagrams showing the position of the stars in ω Cen for our MUSE sample (black circles) and for samples taken from the literature. Left panel for the EHB stars (blue squares, Latour et al. 2018) and right panel for the BHB stars (red squares, Moni Bidin et al. 2012, green squares Moehler et al. 2011). Filled symbols in the left panel indicate the He-rich blue-hook stars. The theoretical HB band for the BaSTI He-normal models is also shown.
Current usage metrics show cumulative count of Article Views (full-text article views including HTML views, PDF and ePub downloads, according to the available data) and Abstracts Views on Vision4Press platform.
Data correspond to usage on the plateform after 2015. The current usage metrics is available 48-96 hours after online publication and is updated daily on week days.
Initial download of the metrics may take a while.